Figure 5.
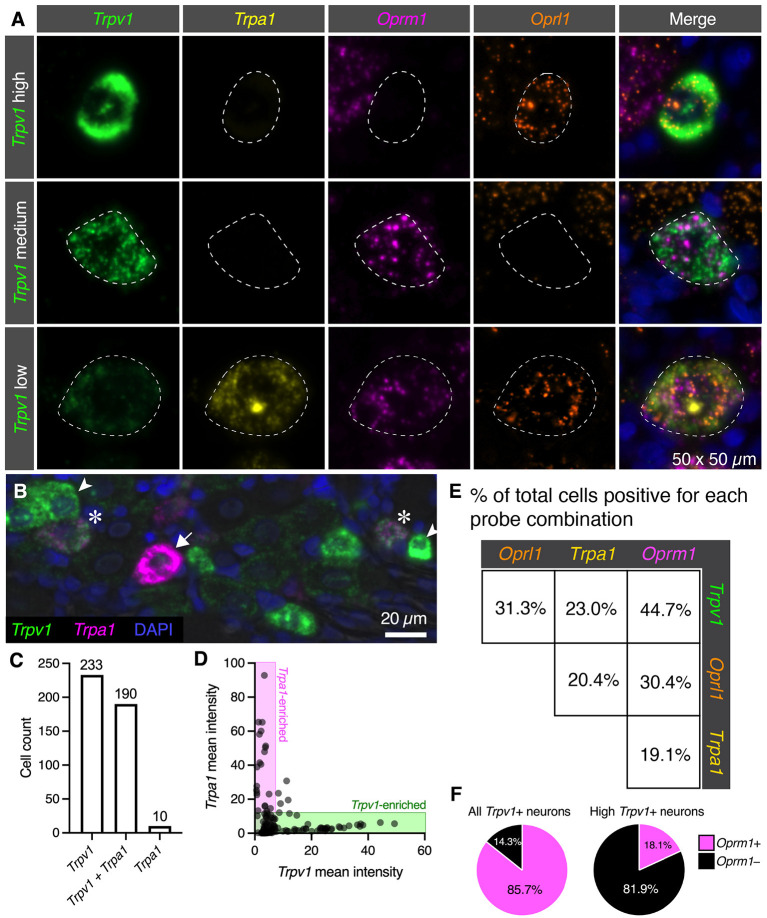
Quantification of nociceptive ion channel and opioid receptors. We further examined the subpopulations of DRG neurons shown in Figure 3. (A) Enlarged and enhanced fields were shown for each of three representative cell populations corresponding to high, medium and low Trpv1 expression. Note that several populations of cells have medium Trpv1 expression, but that one of the most common subtypes (Trpv1 and Oprm1 alone), was selected. Similarly, a quad-positive neuron was selected as representative of low Trpv1 expression. (B) To examine the relationship between Trpv1 and Trpa1 in particular, expression levels in perikarya of cells expressing either marker were examined in further detail. In this representative field, neurons strongly enriched for Trpv1 (arrowheads) or Trpa1 (arrow) are indicated, as well as two neurons (asterisks) that co-express these two ion channel genes. (C) Using cell counting, we identified the coincidence of these two markers. More cells express Trpv1 than Trpa1 with the majority of Trpa1+ cells co-expressing Trpv1, and only 10 Trpa1+ cells expressing no detectable Trpv1. (D) However, cells expressing high levels of either Trpv1 or Trpa1 express very low levels of the other transcript. Therefore, the expression of these two markers while coincident, appears to be anticorrelated (note that points fall on the axes rather than in the middle of the plot. (E) Pairwise coincidence is shown for each of the four labels in this experiment. All of these combinations are common (with the rarest being approximately 19.1% of all cells). High Trpv1 neurons, in particular, seemed to differ from other Trpv1 neurons in terms of Oprm1 expression. (F) We addressed this by counting high Trpv1 neurons separately from other Trpv1 neurons (shown in pie charts). Whereas average Trpv1 neurons expressed Oprm1 the majority of the time (85.7%), the high Trpv1 neurons expressed Oprm1 only 18.1% of the time. On average, the expression in these cells was also lower (Supplementary Figure 3). Outlines (dotted lines) of neuronal perikarya are shown to enhance visbility.

