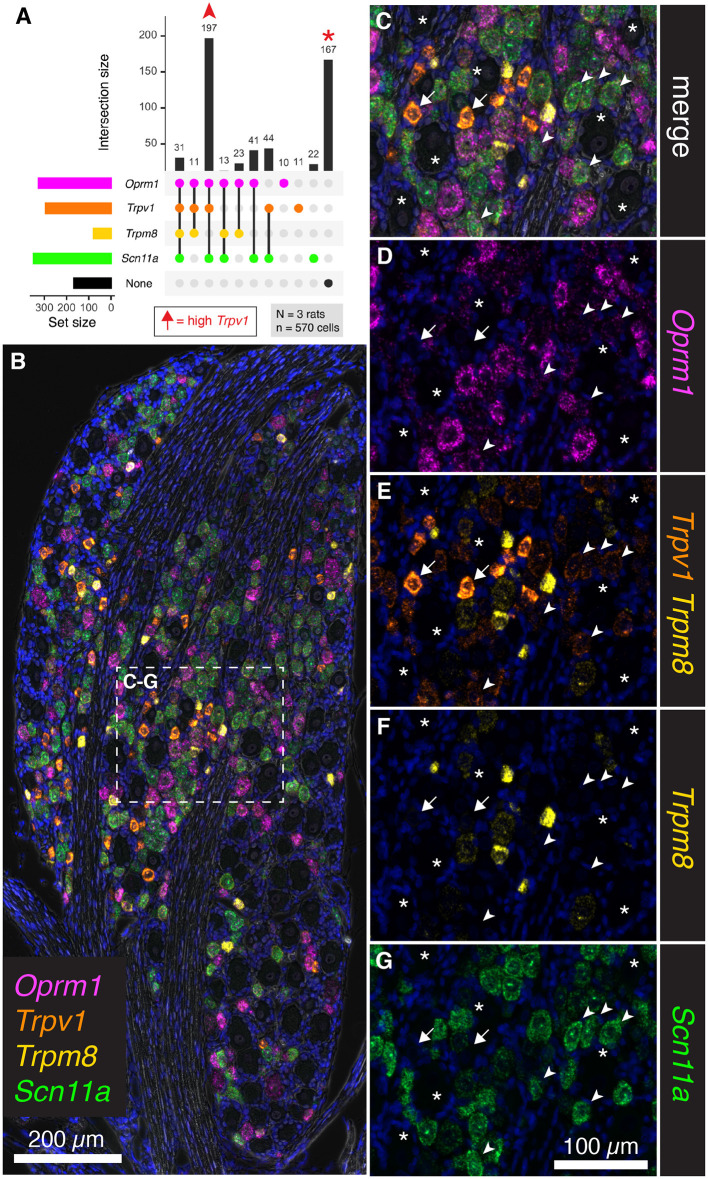
Figure 7.
Co-expression analysis for Trpv1, Trpm8, Oprm1, and Scn11a. To further assess the overlap between nociceptive transducing ion channels and opioid receptors, multiplex fluorescent hybridization was performed for Trpv1, Trpm8, Oprm1 and Scn11a in N = 3 rats (n = 570 cells). In this experiment, we investigated the mRNA coding for the cold-pain transducing nociceptive ion channel Trpm8 as well as the mRNA encoding the voltage-gated ion channel subunit Scn11a. (A) Counts were tabulated for co-expression of these four markers as before. The most prevalent group were neurons co-positive for Trpv1, Oprm1 and Scn11a (197 cells). Notably, a large number of neurons was also unlabeled (167 cells). Arrows in the plot in (A) are used to identify cells in the representative fields in subsequent panels. High Trpv1 neurons (arrows) are not in the plot in (A), but were highlighted in the representative fields. (B) A panoramic stitched image is shown to demonstrate the anatomical location of these markers within the greater structure. In the center of the field, a representative area was enlarged for subsequent panels. (C) Overlay of the 4-plex label with DAPI and brightfield is shown. Note that examples of the most prevalent cell type, Trpv1+/Oprm1+/Scn11a+ neurons are indicated (arrowheads). Larger diameter cells with no reactivity for these markers are indicated (asterisks). A singular putative thermosensing c-fiber is indicated with very high levels of Trpv1 (arrow). (D). Note the varying levels of Oprm1 in Trpv1+/Oprm1+/Scn11a+ neurons (arrowheads), and absence of Oprm1 in the high-expressing Trpv1+ neuron (arrow). (E) In an overlay of Trpv1 and Trpm8, note that cells were generally high in one or the other but not both markers. (F) Also note the sparse labeling of Trpm8, indicative of its specialized function. (G) The sodium channel subunit Scn11a was prevalent in Trpv1+/Oprm1+/Scn11a+ neurons (arrowheads), as well as strongly expressed in many cells throughout the ganglion. Scale bar applies to all images. Scale bar applies to (C–G).

