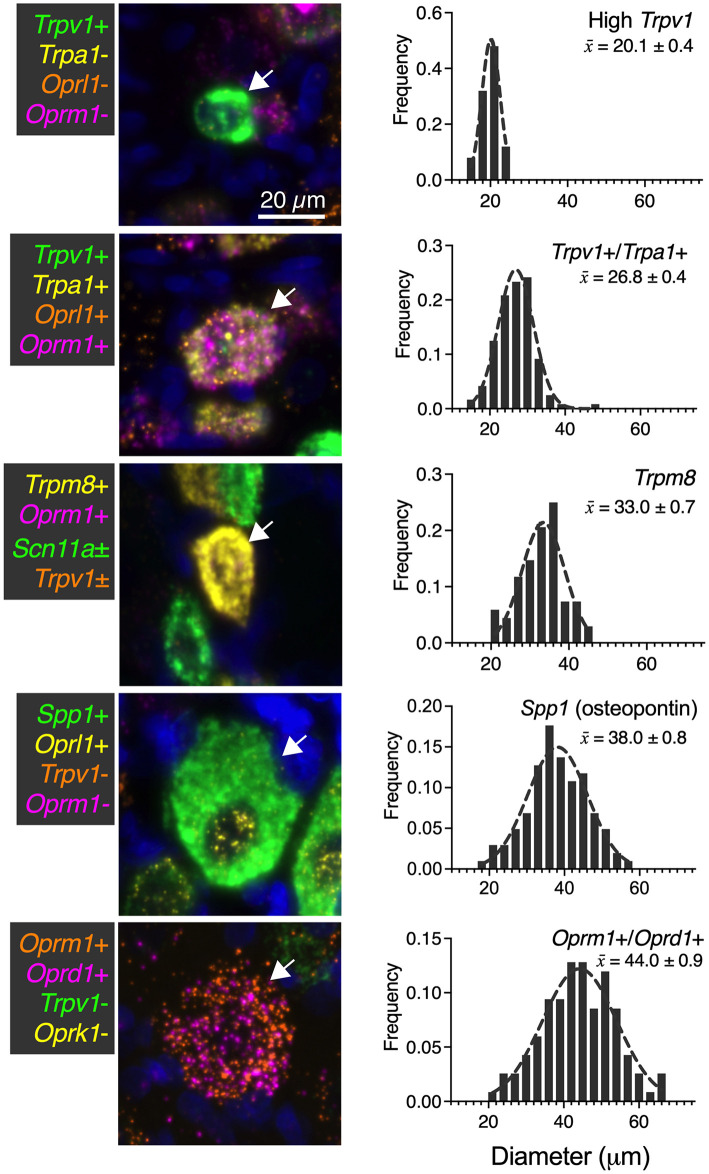
Figure 9.
Summary of identified cell types with size analysis. For each of the major identified cell types in the present study, a representative image (66 μm square) is shown. Additionally, histogram information of the cell size for each population is identified in ascending order of mean size ± SEM. High Trpv1 neurons were the smallest cells (20.1 μm ± 0.4). Oprm1+/Oprd1+ neurons were the largest cells identified, with an average size of 44.0 μm ± 0.9. Scale bar applies to all images. These analyses were performed with at least N = 3 rats.

