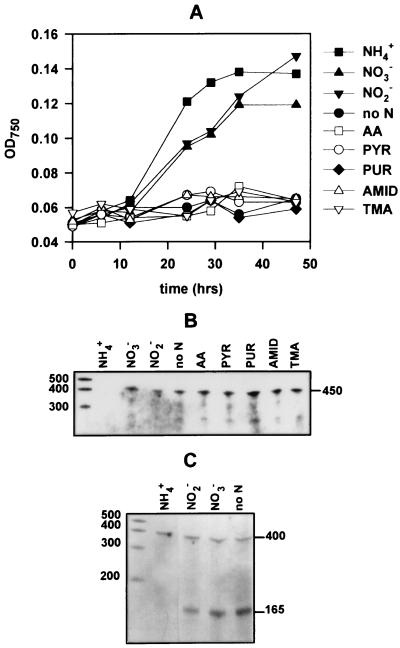
FIG. 5.
(A) Growth curves of cells transferred from ASWNO3 to ASW0 supplemented with a variety of nitrogenous compounds. (B) ntcA transcript levels as determined by RPA analysis using the internal ntcA probe with 5 μg of RNA extracted from cells 4 h after transfer to the different nitrogen sources. Abbreviations: no N, lacking a nitrogenous source; AA, amino acids; PYR, pyrimidines; PUR, purines; AMID, amides; TMA, trimethylamine. (C) RPA analysis with the upstream ntcA probe of 5 μg of RNA extracted from cells grown on inorganic nitrogen sources or deprived of nitrogen (nitrogen sources are shown above the lanes). The sizes of single-stranded RNA standards are indicated (in bases).

