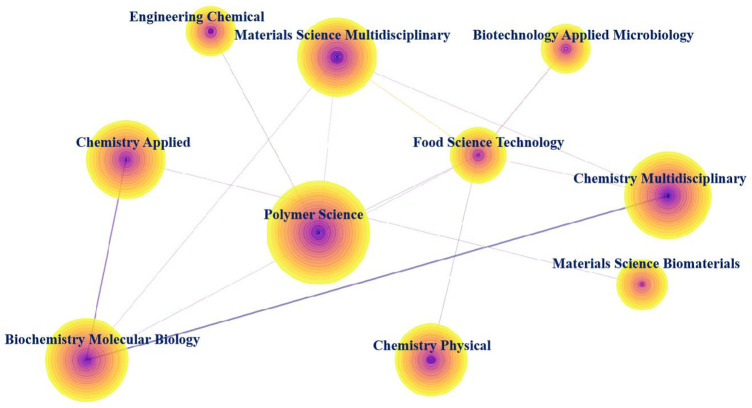
FIGURE 2.
Visualization of the co-occurring subject categories network. (Nodes represent subject categories. The size of a node is proportional to the literature number of the subject category. The links represent the co-occurring relationship between different subject categories. The color of the rings and links corresponds to the year. The purple rings indicate high centrality.)

