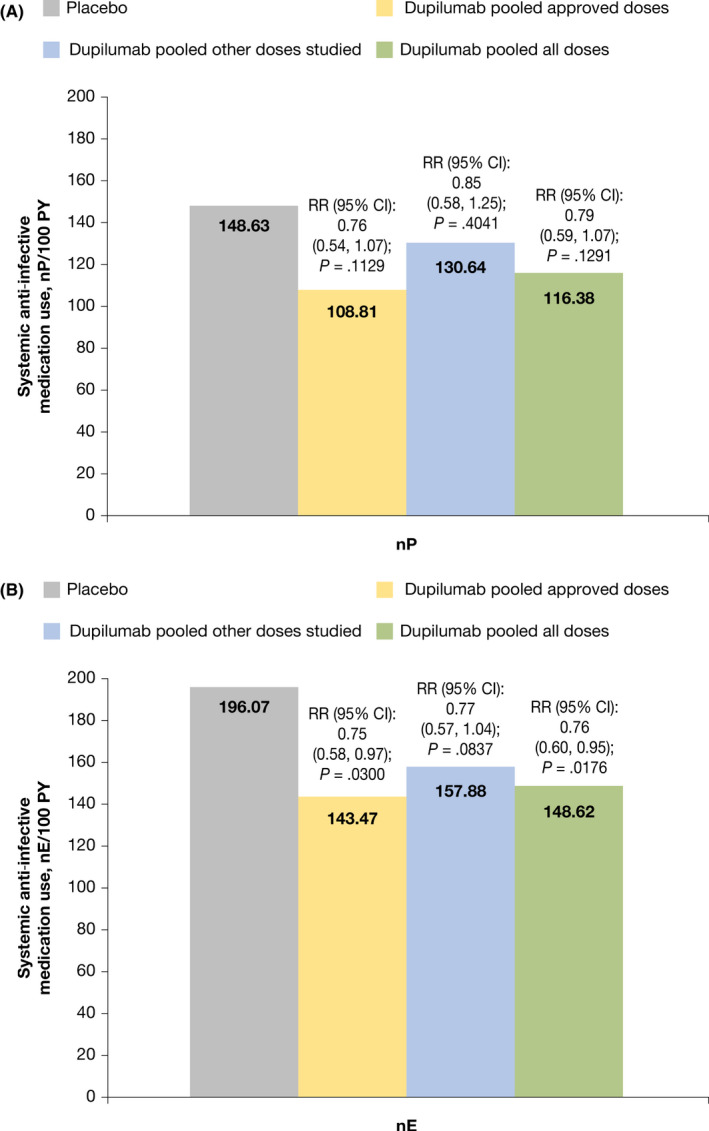
FIGURE 2.

Systemic anti‐infective medication use. (A) Proportion of patients with ≥1 use of systemic anti‐infective medication per 100 PY. (B) Systemic anti‐infective medication use by number of events per 100 PY. CI calculated using normal approximation. RR and p‐values are from time‐to‐event exponential regression model with treatment, randomization factors and study identifier as fixed factors. Stratification factors are baseline disease severity (IGA = 3 vs. IGA = 4) and baseline weight group (<60 kg vs. ≥60 kg) for LIBERTY AD ADOL; stratification factors are region (North America vs. Europe) and baseline weight group (<30 kg vs. ≥30 kg) for LIBERTY AD PEDS. CI, confidence interval; nE, number of events; nP, number of patients with ≥1 event; PY, patient‐years; RR, risk ratio
