
FIGURE 2.
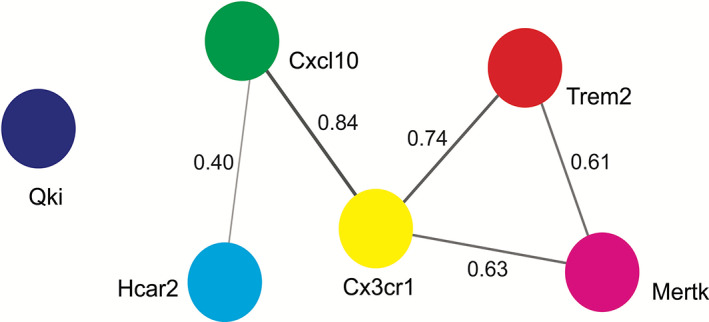
Protein–protein interaction (PPI) analysis. Using a search tool for the retrieval of interacting genes/proteins (STRING), PPI analysis (with confidence level of 0.40) shows the association of Hcar2, Cxcl10, Cx3cr1, Trem2 and Mertk, suggesting that these transcripts work in a complex way in regulating microglial and astrocytic functions. Here, each node represents a transcript and connecting lines show the interaction with each other. The thickness of the lines indicates the strength of interactions, the greater the thickness, the stronger the connection. The strength of connections is based on multiple parameters, including text‐mining, experiments, gene fusion, co‐occurrence, co‐expression, neighborhood, and databases collected in the STRING database. The interaction value is based on the combined score (highest score 0.9) found in the STRING database. Cx3cr1, CX3C chemokine receptor 1; Cxcl10, C‐X‐C motif chemokine ligand 10; Hcar2, hydroxycarboxylic acid receptor 2; Mertk, Mer proto‐oncogene tyrosine kinase; Qki, Quaking protein; Trem2, triggering receptor expressed on myeloid cells‐2