
FIGURE 2.
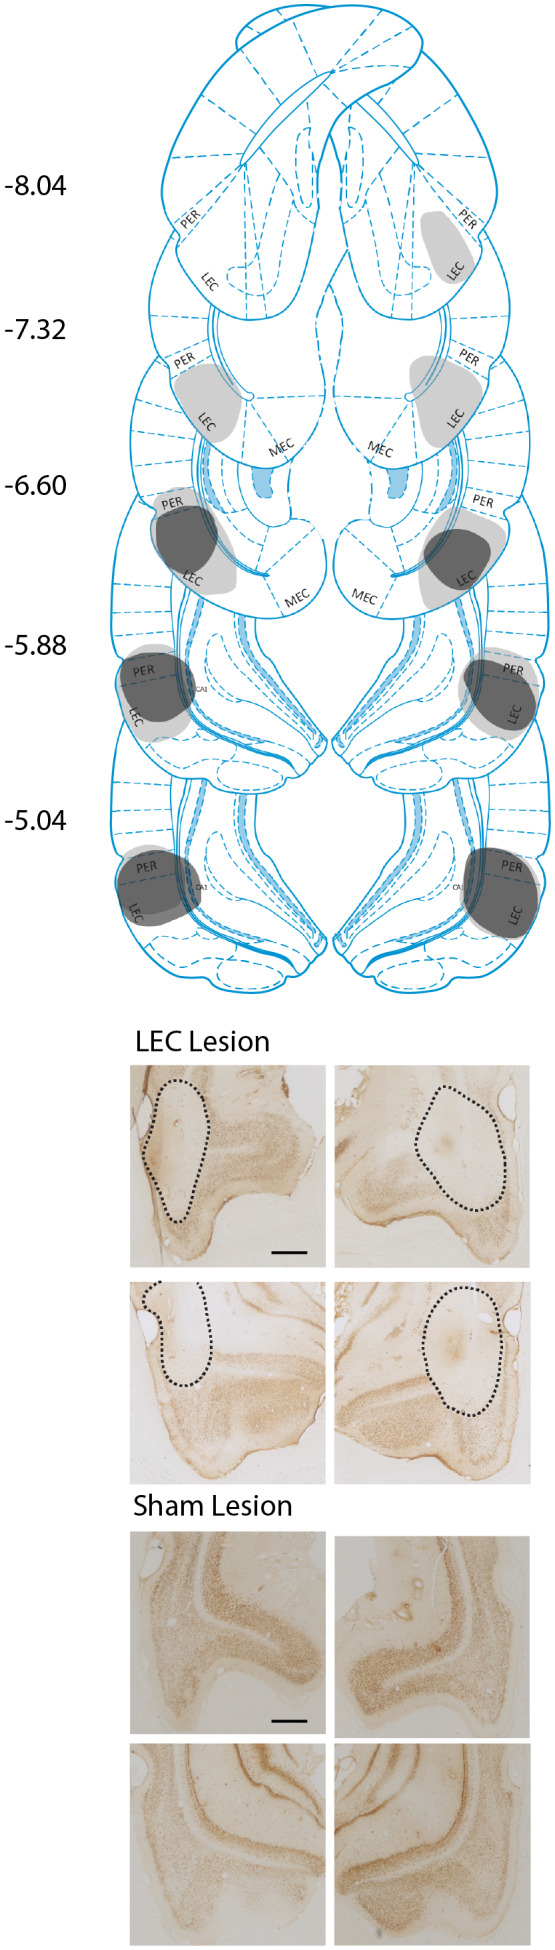
Lesion analysis. (a) Examples of the extent of lesions across the brain. Gray = largest lesion (rat 7) and black = smallest lesion (rat 144). Numbers represent distance from the bregma. (b) Example images showing extent of LEC lesions (top), and the absence of any damage in sham‐lesioned animals (bottom). Representations of coronal sections adapted from Paxinos and Watson (2007). Scale bar in top left image represents 500 μm