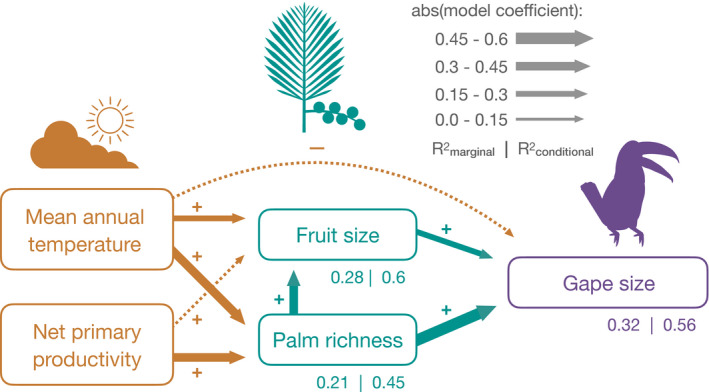
FIGURE 2.

Path diagram showing how climate, fruit size and palm richness affect bird gape size. For all variables the maximum observed value of each botanical country (see Methods) was used, and Wallace realm (Holt et al., 2013) was specified as a random effect in the piecewise SEM sub‐models. Line widths are scaled to the absolute value of model coefficients, solid lines indicate significant and dotted lines non‐significant relationships. See Table S1 for path coefficients and Figure S6 for a path model fit with median values for botanical countries
