
FIGURE 3.
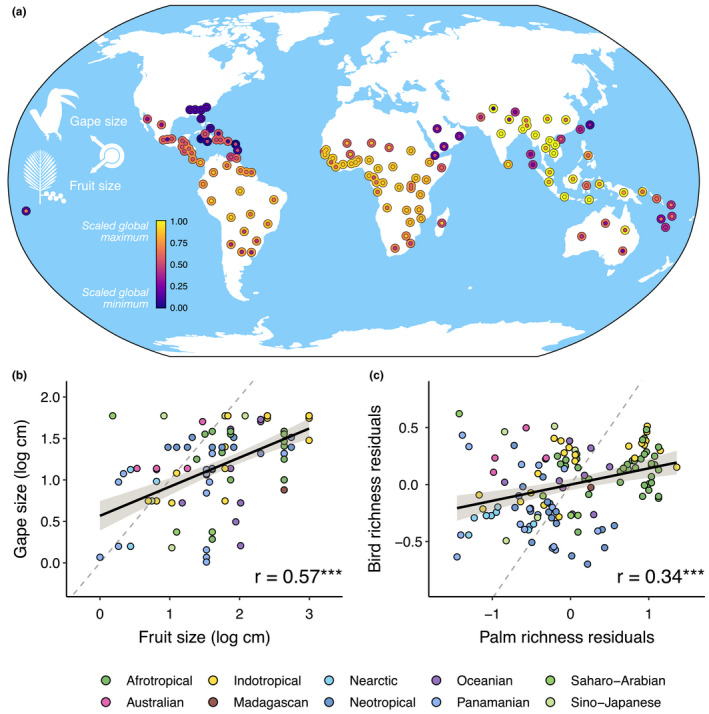
Global associations between palm fruit size and bird gape size. (a) Spatial variation in bird and palm trait matching across botanical countries (see Methods). Outer ring of each point is coloured by gape size while inner points are coloured by fruit size, warmer colours indicate higher values. Values are the maximum for each botanical country, logged and rescaled to 0–1, and plotted at the centroid position. See Figure S2 for names of each botanical country. (b) Fruit and gape size are correlated at the global scale, as are residuals calculated from a regression with log‐transformed gape and fruit size and log transformed bird and palm richness values for each botanical country (c, see Methods). Points are coloured according to Wallace realm (sensu Holt et al., 2013), dashed line is the line of isometry, ***p < 0.001