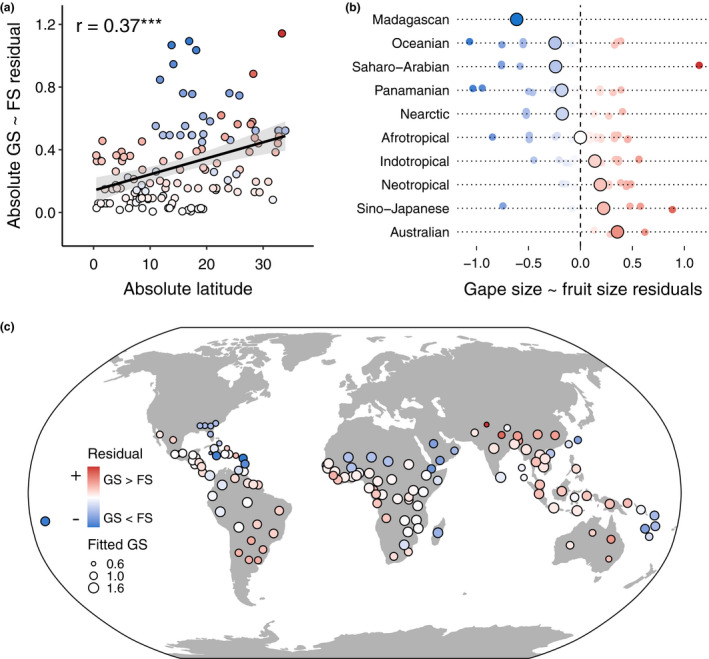
FIGURE 5.

Global matching patterns of gape size (GS) and fruit size (FS). (a) Absolute residual values from a regression between log‐transformed gape and fruit size (see Figure 3b) decrease towards the equator (absolute latitude = 0), suggesting the strength of trait matching is strongest in equatorial regions. More red colours indicate a location has frugivores with larger gape sizes than predicted by fruit size, and more blue colours the opposite. (b) Trait matching strength differs among zoogeographic realms, as quantified via residuals from the gape size ~fruit size regression (Figure 3b). (c) Global spatial variation in the residuals of the gape size ~fruit size regression used to make panels a and b, with points coloured as in panels a and b, and point size scaled to the fitted value of gape size from the same regression (Figure 3b). See Figure S2 for names of each botanical country
