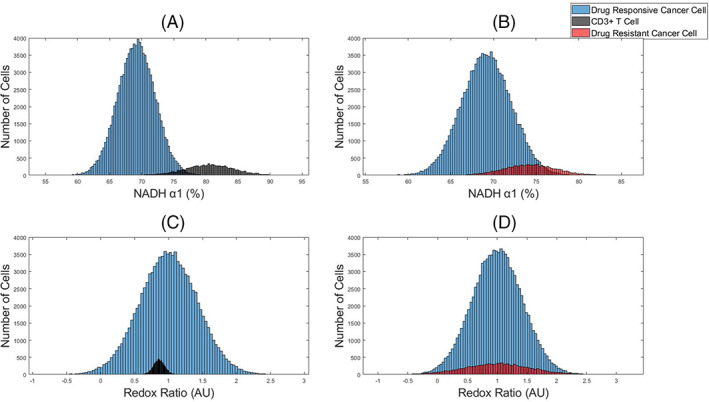
FIGURE 1.

Representative histograms of OMI features to identify subpopulations within simulated OMI datasets of tumors. NAD(P)H α1 (A–B) and optical redox ratio (C–D) data of a main population of drug responsive cancer cells (blue) and a subpopulation of either T cells (black) or drug resistant cancer cells (red). The main population consists of 100,000 cells and the subpopulation is 10,000 cells, 10% of the total population [Color figure can be viewed at wileyonlinelibrary.com]
