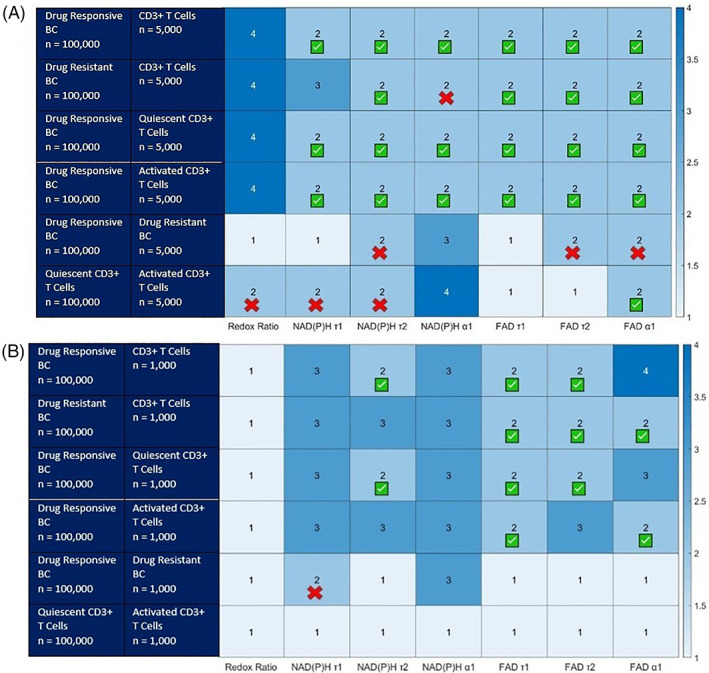
FIGURE 2.

Number of distinct cell populations identified using Gaussian mixed models within simulated OMI datasets of varying combinations of drug resistant cancer cells, drug responsive cancer cells, and T cells. [A] (top) the smaller population is 5% of the total population, 100,000 total simulated cells. [B] (bottom) the smaller population is 1% of the total population, 100,000 total simulated cells. The red Xs identify models where the proportion error exceeds 5% (false positive). These population and features cannot be counted as successful. The green check indicates the proportion, mean, and standard deviation of each population is identified correctly (less than 5% error. BC = breast cancer [Color figure can be viewed at wileyonlinelibrary.com]
