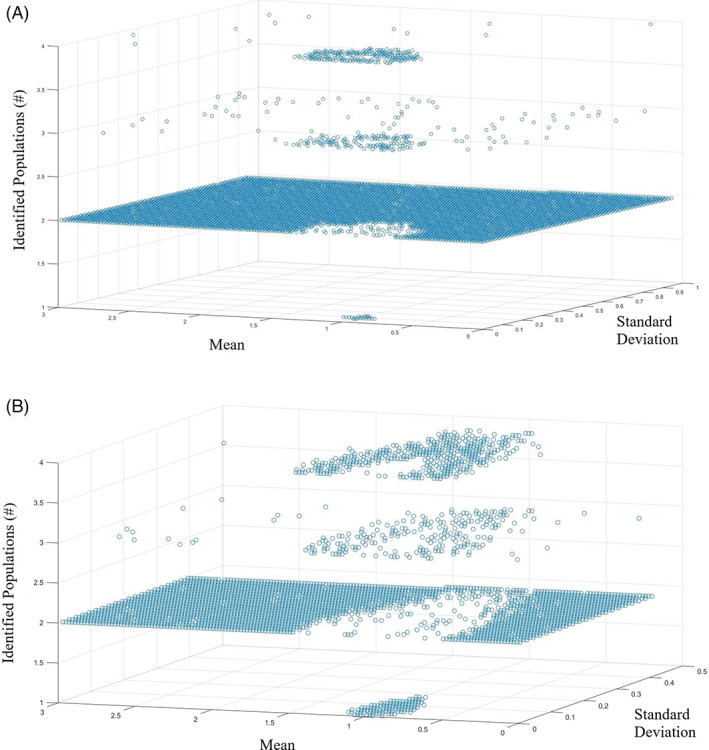
FIGURE 3.

Normalized mean and standard deviation values in which the model identifies two separate populations. [A] (top) shows the case where the subpopulation is 5% of the total population. [B] (bottom) shows the case where the subpopulation is 1% of the total population [Color figure can be viewed at wileyonlinelibrary.com]
