
Fig. 2. Characterization of the fully inkjet-printed multimodal sensor arrays on the e-skin-R.
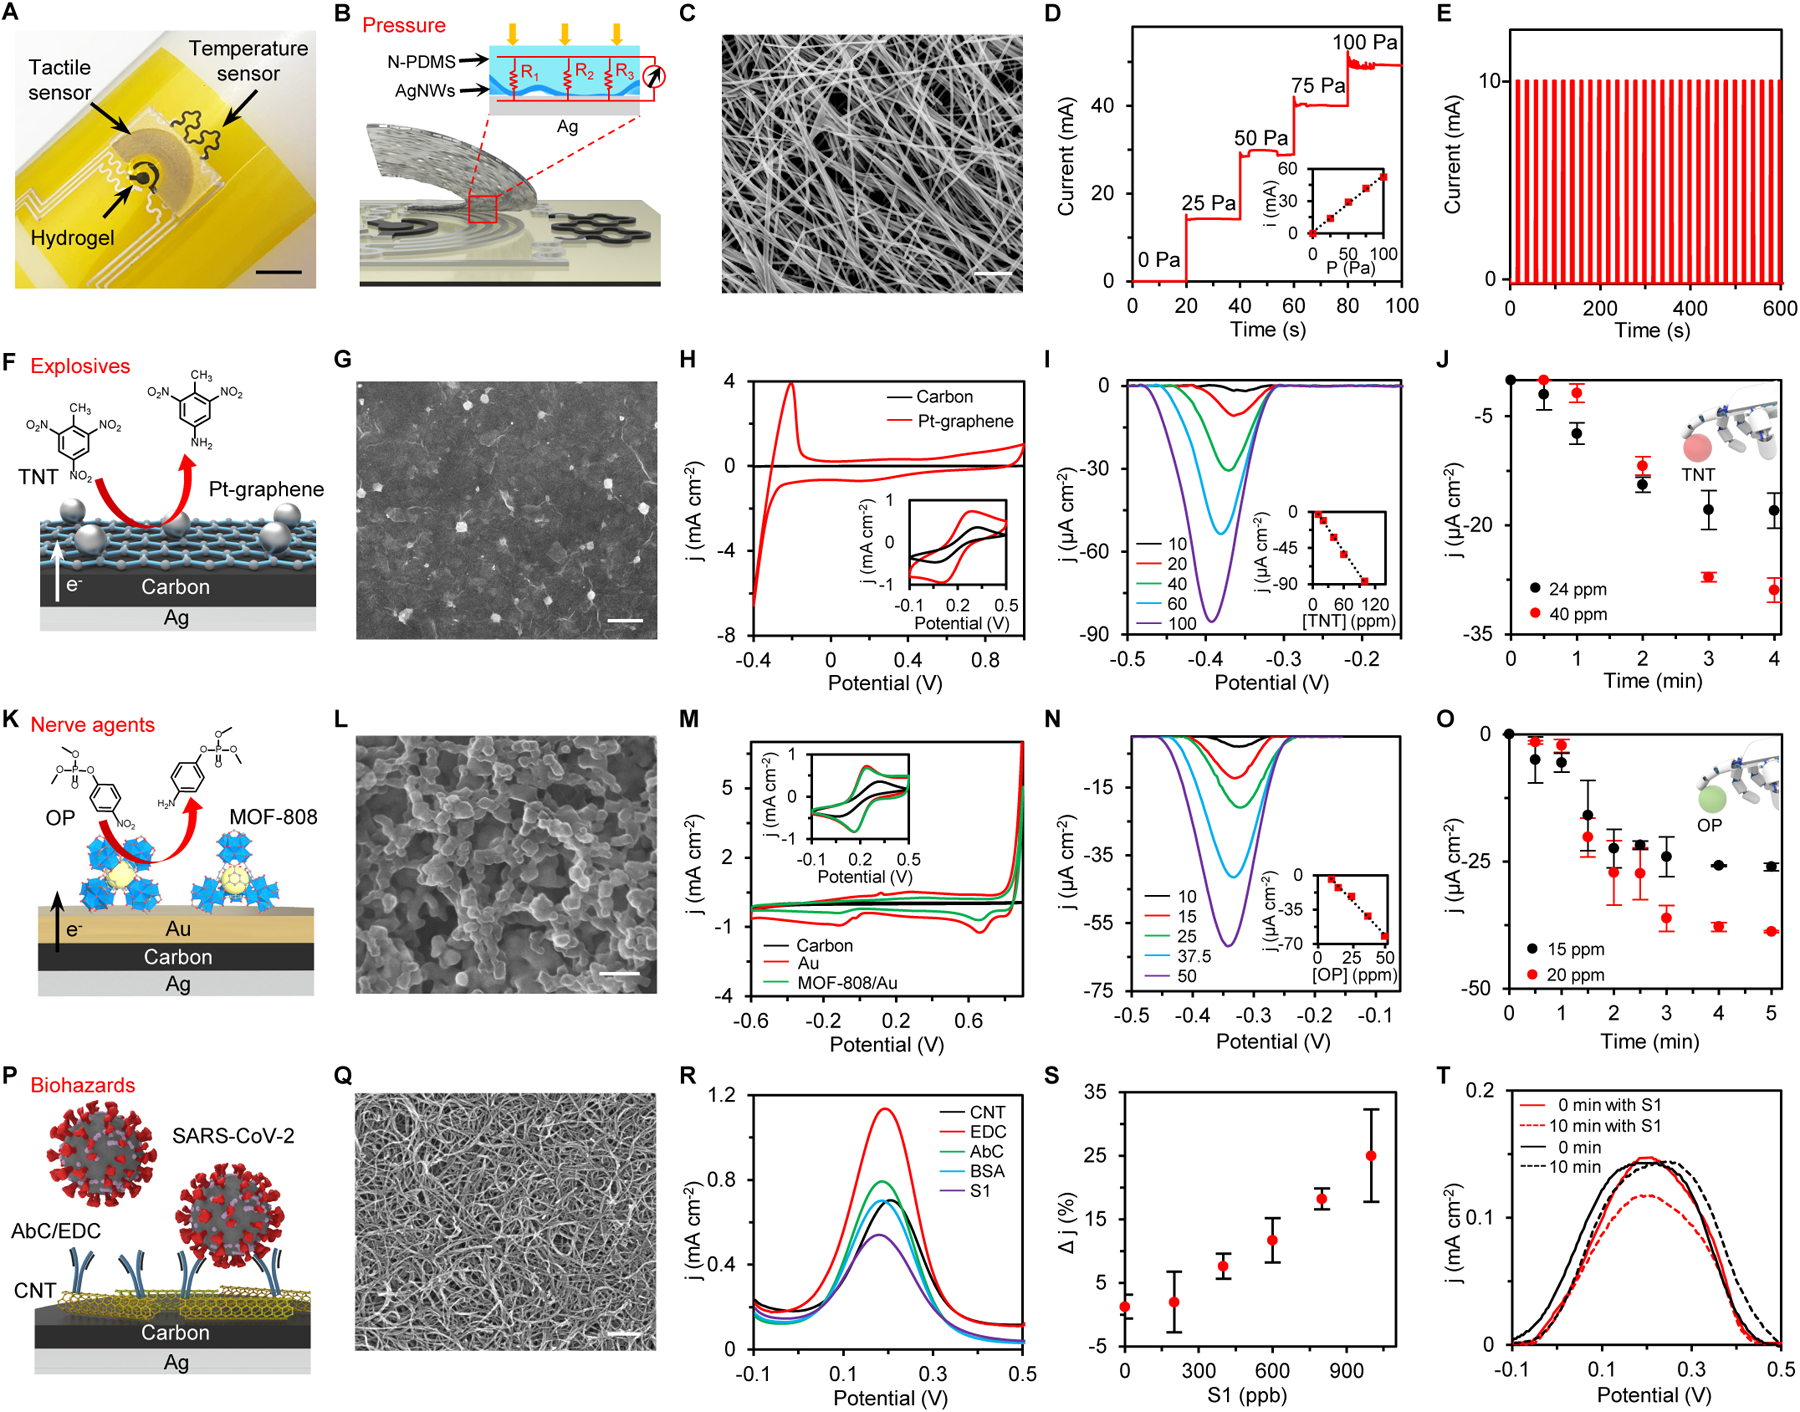
(A) Photograph of a multimodal flexible sensor array printed with custom nanomaterial inks that consists of a temperature sensor, a tactile sensor, and an electrochemical sensor coated with a soft analyte-sampling hydrogel film. Scale bar, 5 mm. (B and C) Schematic (B) and scanning electron microscopy (SEM) image (C) of the printed AgNWs/N-PDMS tactile sensor. Scale bar, 1 μm. (D and E) Response of a tactile sensor under varied pressure loads (D) and repetitive pressure loading (E). (F and G) Schematic (F) and SEM (G) of the printed Pt-graphene electrode for TNT detection. Scale bar, 4 μm. (H) Cyclic voltammograms (CVs) of an IPCE and a printed Pt-graphene electrode in 0.5 M H2SO4 and in 5 mM K3Fe(CN)6 (inset). j, current density. (I) nDPV voltammograms and the calibration plots (inset) of TNT detection using a Pt-graphene electrode. (J) Dynamics of robotic fingertip detection of dry-phase TNT using a Pt-graphene sensor. (K and L) Schematic (K) and SEM image (L) of the printed MOF-808/Au electrode for OP detection. Scale bar, 100 nm. (M) CVs of an IPCE, a Au electrode, and a MOF-808/Au electrode in McIlvaine buffer and in 5 mM K3Fe(CN)6 (inset). (N) nDPV voltammograms of the OP detection. Inset, the calibration plots. (O) Robotic fingertip detection of dry-phase OP using a MOF-808/Au sensor. (P and Q) Schematic (P) and SEM image (Q) of the printed CNT electrode for SARS-CoV-2 detection. Scale bar, 250 nm. (R) DPV voltammograms of a printed CNT electrode in 5 mM K3Fe(CN)6 after each surface immobilization step. EDC, 1-ethyl-3-(3-dimethylamonipropyl)carbodiimide; AbC, capture antibody; BSA, bovine serum albumin. (S) Calibration plots of the CNT-based sensor for S1 detection. Δj, percentage DPV peak current changes after target incubation. (T) Response of a CNT sensor in the presence and absence of dry-phase S1. All error bars represent the s.d. from 3 sensors.