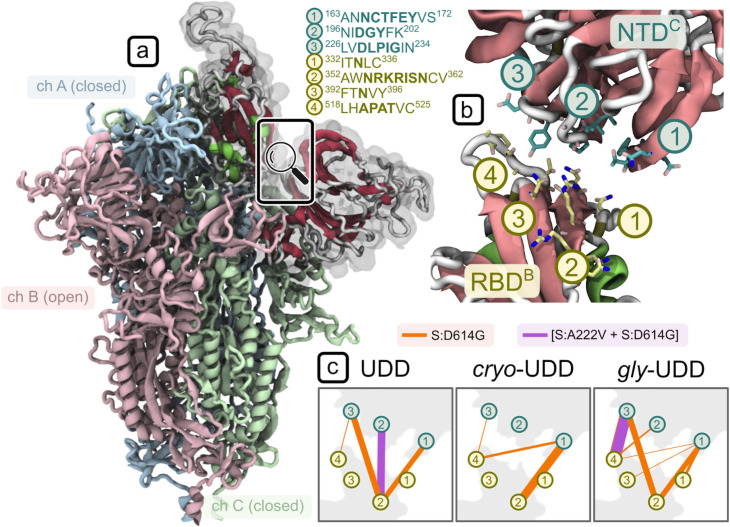
Fig 7. Dynamic network analysis for a subsystem consisting of the open RBD and its neighbouring NTD.
(a) Open RBD of the simulated 1-up (UDD) SARS-CoV-2 Spike mutants. (b) Residue communities (3 for NTD, in teal, and 4 for RBD, in yellow) engaged in inter-domain contacts, along with their position in the protein sequence. The domains shown here are those highlighted with gray transparency in (a). (c) Communication pathways are highlighted with connecting lines whose thickness is proportional to the inter-domain betweenness centrality values. Orange connections represent the S:D614G and violet the [S:A222V + S:D614G] mutant; data is reported for the three systems: glycan-free from 6VSB (UDD), glycan-free from our cryo-EM data (cryo-UDD), and glycosylated from 6VSB (gly-UDD).

