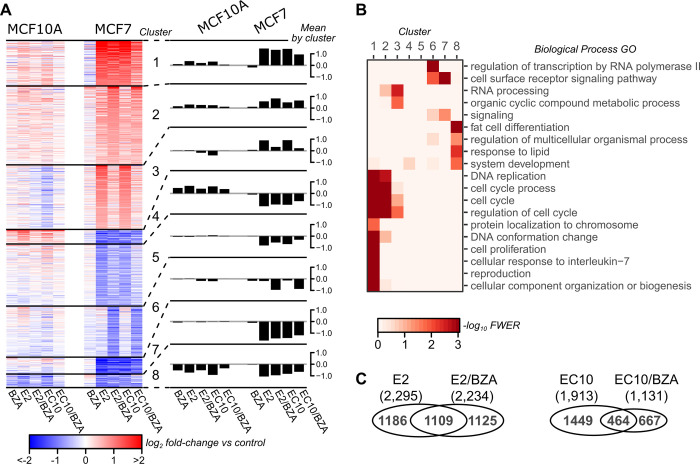
Fig 1. Gene expression changes with SERM/SERD treatments (bazedoxifene–BZA) in MCF10A and MCF7 cell lines, as evaluated by RNA-seq.
A) Clustering of 3,820 differentially expressed genes. Values are average log2 fold change (FC) of normalized counts in 3 independent replicates relative to the untreated control for each cell line. Eight clusters were calculated using k-means. Data for individual genes are presented in the left panel heatmap, and mean values (log2 fold-change) in each cluster are presented in the right panel barplots. B) Biological process gene ontology (GO) enrichment per cluster. Terms shown are the least redundant terms as determined by REViGO. C) Venn diagram comparing differentially expressed genes in MCF7 between E2 vs E2/BZA (left) and EC10 versus EC10/BZA (right); each of the 4 groups are relative to control.

