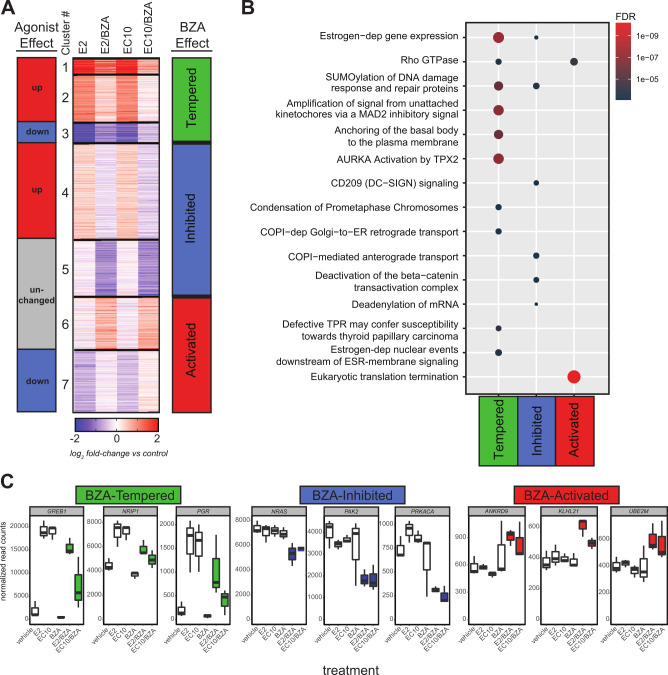
Fig 2. BZA alters steroid responsiveness in the MCF7 cell line.
A) Clustering analysis of 2,332 genes comparing BZA-induced changes in E2 or EC10 responses. There are seven distinct clusters that group into different agonist effect groups (E2 or EC10) or into three different BZA-effect groups (Tempered, Inhibited, Activated) based on the effect of BZA on agonist responses. B) Reactome pathway enrichment analysis of BZA-effect groups from Fig 2A. The top enriched Reactome gene sets are shown in dot plot, where each dot is an enriched gene set, the color represents the significance, and the size signifies the gene set size. C) Normalized RNA-seq expression values of selected genes from each BZA-effect group (Tempered, Inhibited, Activated). Data shown are from MCF7 RNA-seq DESeq2-normalized read counts from each treatment group (n = 3 replicates per group). The E2/BZA and EC10/BZA treatments are color-coded according to the BZA-effect groups from Fig 2A.

