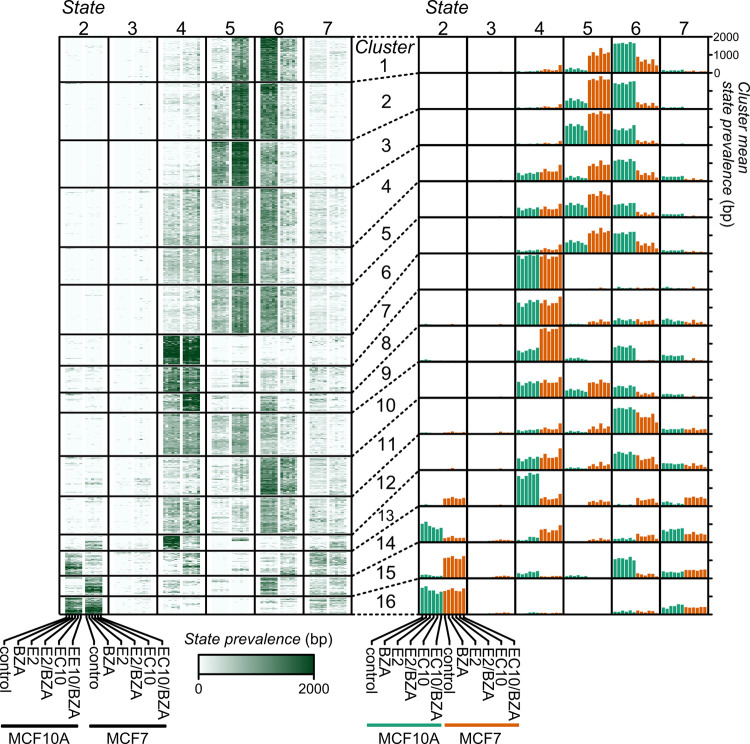
Fig 3. Chromatin state dynamics near RefSeq gene Transcription Start Sites (TSS) in MCF10A and MCF7 cells treated with bazedoxifene.
The number of base pairs assigned to each state is within a 2kb window centered on 18,614 TSSs clustered and presented in heatmaps (left) or aggregated barplots (right). State 1 is omitted due to its extreme rarity in order to improve clarity. Minor columns represent the prevalence of the state in each cell line and treatment combination as indicated at the bottom, repeating in each major column (left panel). For the right panel, the clusters are summarized by mean value and the columns are arranged as in the left panel. Chromatin states: 2 –repression; 3 –mixed signal; 4 –low signal; 5 –active; 6 –poised; 7 –low signal.

