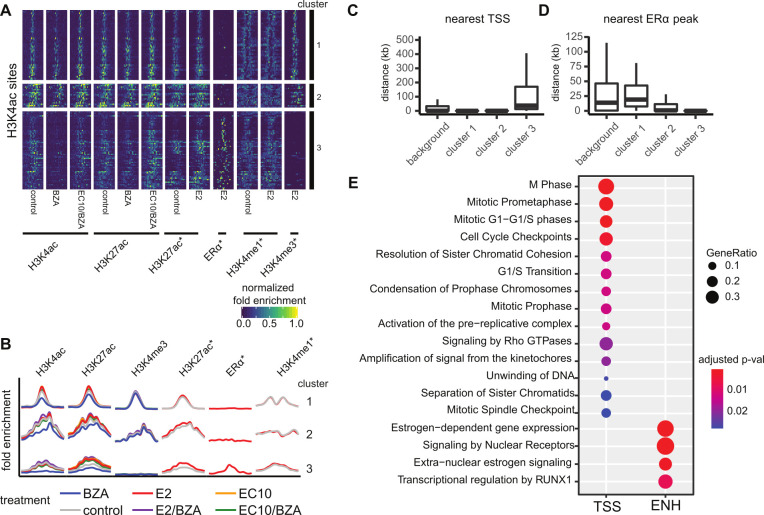
Fig 4. H3K4ac is regulated in response to bazedoxifene treatment in MCF7 cells.
Clustering of 130 differentially enriched H3K4ac marked regions reveals two distinct epigenetic signatures. A) Heatmap of enrichment profiles across genomic regions within 4kb of H3K4ac sites clustered using k-means (k = 3). B) Aggregated mean profiles of clusters identified in A; the x-axis corresponds to the mean normalized fold-enrichment values. C) Distance by cluster from each site to the nearest transcript start site (TSS) of a protein-coding gene. D) Distance by cluster from each site to the nearest ERα peak. E) KEGG enrichment analysis of pathways associated with genes nearby cluster 1 and 2 promoter proximal regions (TSS) or cluster 3 enhancer (ENH) regions.

