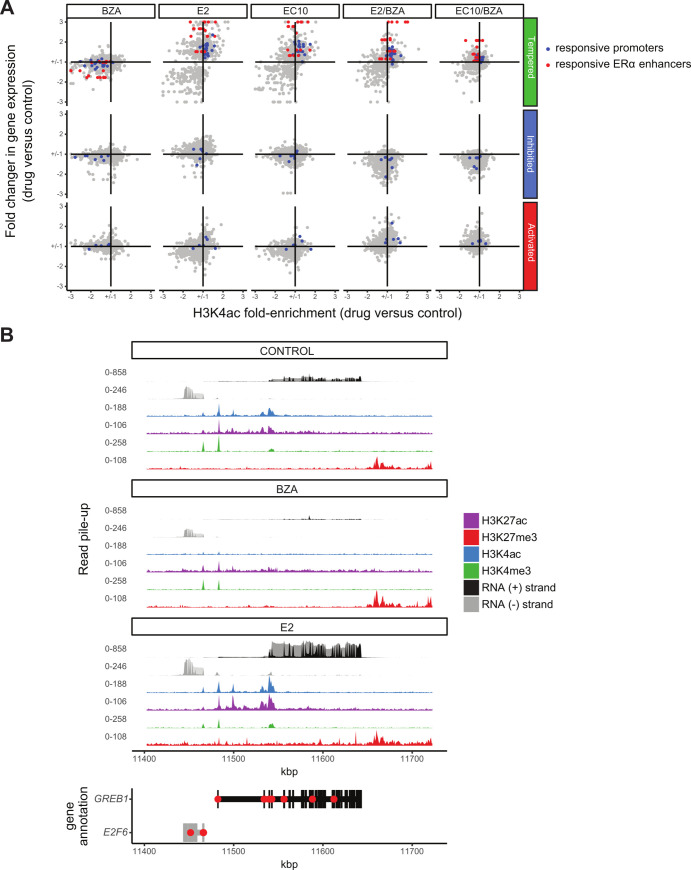
Fig 5. Changes in H3K4ac correspond to expression changes for nearby genes.
A) Scatterplots showing the fold-change in gene expression versus the fold-enrichment change in H3K4ac signal for each drug treatment versus control, respectively. The two types of significantly differentially enriched H3K4ac regions are shown separately for genes that belong to each BZA-effect group (Tempered, Inhibited and Activated). The color of the dots is based on clustering from Fig 4 and corresponds to the genes of non-ERα bound promoters (blue points) and ERα bound enhancers (red points). Fold enrichment changes are capped at 3 for each comparison. B) Effects of BZA and E2 on GREB1 gene expression and histone modifications relative to Control.

