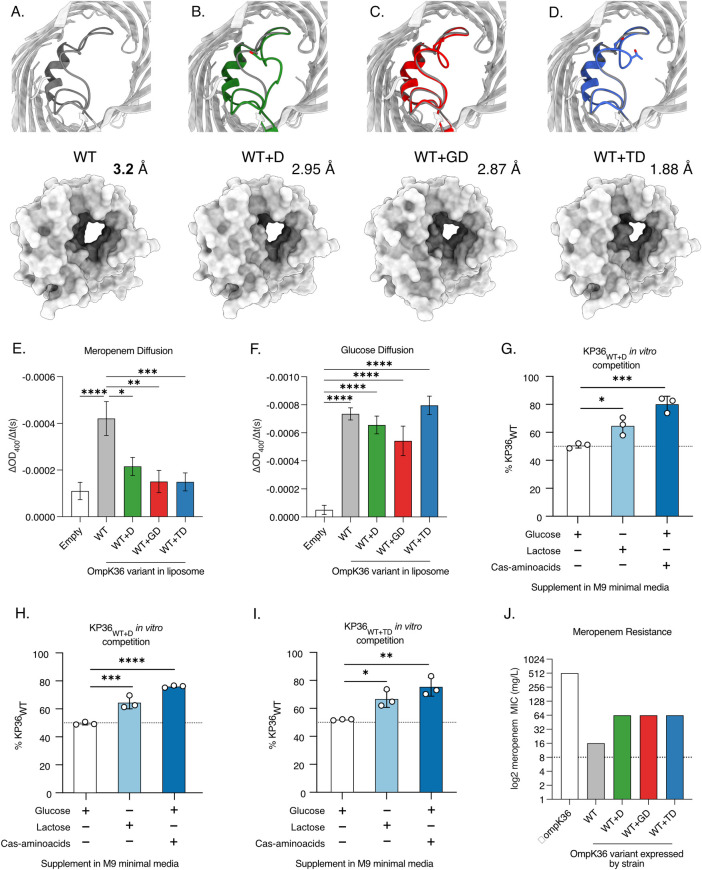
Fig 4. L3 insertions reduce OmpK36 pore diameter and restrict the diffusion of meropenem.
A-D. Cartoon illustrations of OmpK36 (grey) in which L3 is coloured for all the variants; the view is from the extracellular space and perpendicular to the membrane (top panels). Insertions in L3 reduce the relative pore radius as calculated by the program HOLE [58]; surface representation to show the impact of the mutations in the pore size (bottom panels). E-F. Rate of diffusion (ΔOD400/t(s) of meropenem (E) and glucose (F) as determined by liposome swelling assays for different OmpK36 variants. G-I: In vitro competition against KP36WT and KP36WT+D (G), KP36WT+GD (H) and KP36WT+TD (I). No competitive advantage is observed when glucose is added to the M9 minimal media. Lactose and cas-aminoacids supplementation results in outcompetition of L3 insertion expressing strains by KP36WT. J. Median meropenem MIC values for strains encoding different ompK36 variants (n = 3 replicates). E-F: All comparisons not shown were non-significant. Error bars ±SEM. * p<0.332; ** p<0.0021, *** p<0.0002, **** p<0.00001, statistical significance determined by ordinary one-way ANOVA with Tukey’s multiple comparison test. G-I: Error bars ±SD. *, * p<0.332; ** p<0.0021, *** p<0.0002, **** p<0.00001, statistical significance determined by ordinary one-way ANOVA with Dunnett’s multiple comparison to glucose supplementation with a single pooled variance.

