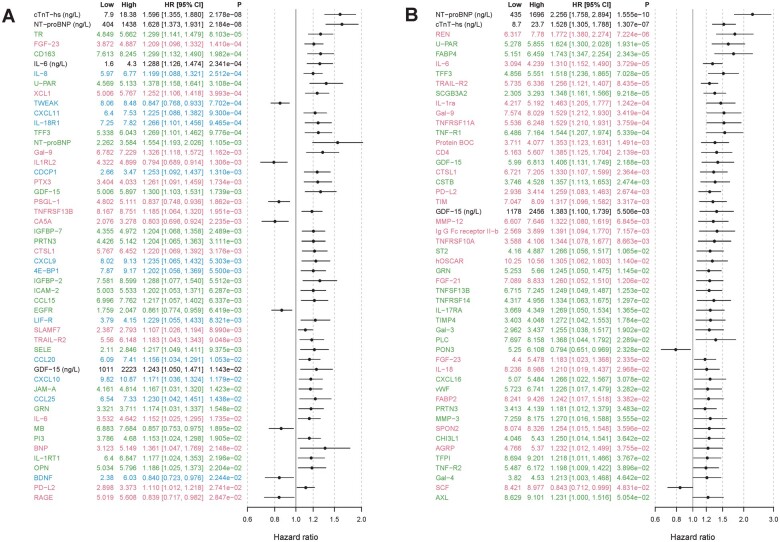
Figure 2.
Forest plot of the top 50 biomarkers associated with CV death according to adjusted Cox-regression analysis in (A) the identification cohort and (B) the validation cohort (by P-value). A forest plot showing all 255 biomarkers is available in Supplementary material online, Figures S1 and S2. Red colour indicates biomarkers analysed on CVD II panel, green colour CVD III, and blue colour inflammation panel. Biomarkers listed in black were analysed with conventional immunoassays. Model adjusted for baseline characteristics, renal function, and cardiac biomarkers [N-terminal pro-B-type natriuretic peptide (NT-proBNP), cardiac troponin T (cTnT-hs)]. The identification cohort included 517 cases with CV death during follow-up and 4057 randomly selected patients for comparison. The validation cohort included 277 cases with CV death during follow-up and 1042 randomly selected patients for comparison.

