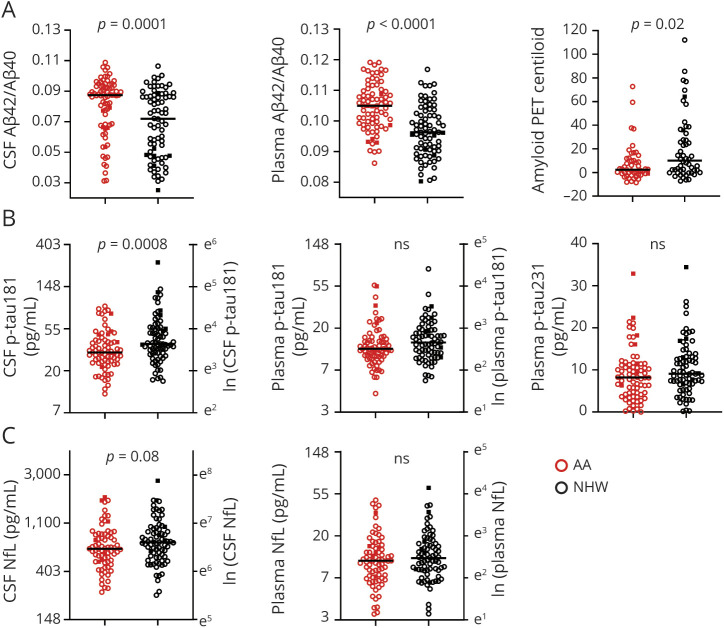
Figure 1. Biomarkers by Race.
Biomarkers of amyloid (A), tau (B), and neuroaxonal injury (C) are shown by self-identified race. The covariate-adjusted significance of racial differences was evaluated using analysis of covariance models with biomarker concentrations as the outcome measure, race as the predictor variable, and the covariates of sex, age, APOE ε4 carrier status, and cognitive status. Plasma tau phosphorylated at position 181 (p-tau181) and neurofilament light chain (NfL) were transformed with the natural logarithm for analysis. Point types denote the following: race: red, African American (AA); black, non-Hispanic White (NHW); cognitive status: open circle, Clinical Dementia Rating (CDR) 0; closed square, CDR >0. Aβ = β-amyloid.

