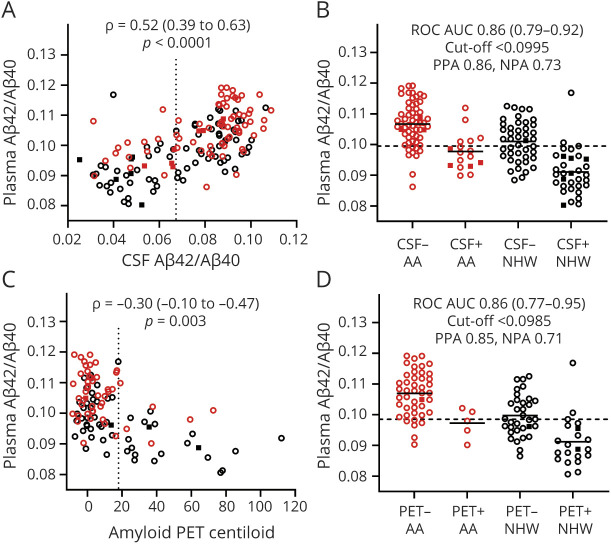
Figure 2. Relationship of Plasma Aβ42/Aβ40 With CSF Aβ42/Aβ40 and Amyloid PET.
The relationship between plasma Aβ42/Aβ40 and CSF Aβ42/Aβ40 (A) or amyloid PET Centiloid (C) was evaluated by partial Spearman correlation and was adjusted for age, sex, APOE ε4 carrier status, self-identified race, and cognitive status. Vertical dotted lines represent cutoff values for amyloid positivity. Plasma Aβ42/Aβ40 for African American (AA) and non-Hispanic White (NHW) groups were evaluated by CSF Aβ42/Aβ40 status (positive <0.0673) (B) or amyloid PET status (D). Cutoff values for plasma Aβ42/Aβ40 with the highest combined sensitivity and specificity for distinguishing amyloid status were selected and are denoted by horizontal dashed lines. The receiver operating characteristic area under the curve (ROC AUC), positive percent agreement (PPA), and negative percent agreement (NPA) are shown. Point types denote the following: race: red, AA; black, NHW; cognitive status: open circle, Clinical Dementia Rating (CDR) 0; closed square, CDR > 0.

