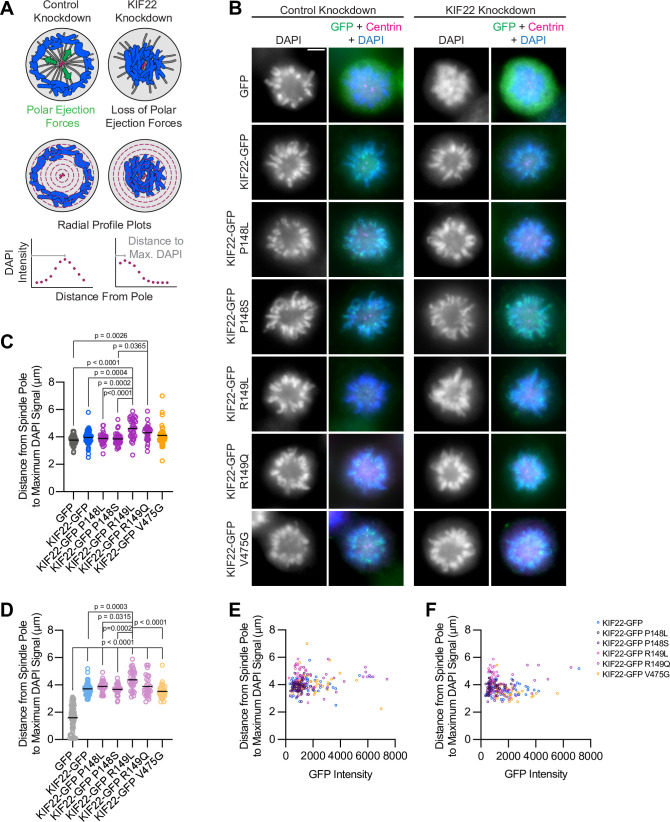
Figure 3. Pathogenic mutations in KIF22 do not reduce polar ejection forces.
(A) Schematic of changes in chromosome positions resulting from loss of polar ejection forces. In cells with monopolar spindles, both spindle poles (magenta) are positioned together and chromosomes (blue) are pushed toward the cell periphery by polar ejection forces (green) (left). In cells depleted of KIF22, polar ejection forces are reduced and chromosomes collapse in toward the center of the cell (right). Relative polar ejection forces were quantified using radial profile plots to measure the distance from the spindle pole to the maximum DAPI signal intensity. (B) Immunofluorescence images of monopolar HeLa-Kyoto cells. KIF22-GFP was visualized using an anti-GFP antibody. Fixed approximately 2–3 hr after treatment with monastrol and 24 hr after siRNA transfection and treatment with doxycycline to induce expression. Scale bar 5 μm. Images are representative of three or more experiments. (C) Distance from the spindle pole to the maximum DAPI signal, a measure of relative polar ejection force level, in cells transfected with control siRNA. Fifty-nine GFP cells from seven experiments, 69 KIF22-GFP cells from six experiments, 31 KIF22-GFP P148L cells from three experiments, 37 KIF22-GFP P148S cells from three experiments, 33 KIF22-GFP R149L cells from three experiments, 28 KIF22-GFP R149Q cells from three experiments, and 45 KIF22-GFP V475G cells from three experiments. (D) Distance from the spindle pole to the maximum DAPI signal in cells transfected with KIF22 siRNA. Seventy-five GFP cells from seven experiments, 57 KIF22-GFP from six experiments, 28 KIF22-GFP P148L cells from three experiments, 30 KIF22-GFP P148S cells from three experiments, 33 KIF22-GFP R149L cells from three experiments, 26 KIF22-GFP R149Q cells from three experiments, and 34 KIF22-GFP V475G cells. For (C, D), bars indicate means. P values from Brown-Forsythe and Welch ANOVA with Dunnett’s T3 multiple comparisons test. P values are greater than 0.05 for comparisons without a marked p value. (E, F) Background-subtracted GFP intensity plotted against the distance from the spindle pole to the maximum DAPI signal to assess dependence of polar ejection force generation on expression levels in cells transfected with control siRNA (E) (Pearson correlation coefficient 0.105, two-tailed p value 0.1031) or KIF22 siRNA (F) (Pearson correlation coefficient –0.005, two-tailed p value 0.9427). See Figure 3—source data 1.

