. 2022 Jun 22;11:e78653. doi: 10.7554/eLife.78653

Figure 4. Pathogenic mutations in KIF22 disrupt anaphase chromosome segregation.

(A) Time-lapse images of dividing HeLa-Kyoto cells expressing KIF22-GFP R149Q or KIF22-GFP V475G. Times indicate minutes after anaphase onset. Images are maximum intensity projections in z through the entirety of the spindle. Imaged approximately 18 hr after treatment with doxycycline to induce expression. Scale bar 5 μm. Images are representative of three or more experiments. (B) Distance between separating chromosome masses throughout anaphase in HeLa-Kyoto cells. Lines represent the mean and the shaded area denotes SEM. Forty-three KIF22-GFP cells from 10 experiments, 21 KIF22-GFP P148L cells from 6 experiments, 28 KIF22-GFP P148S cells from 7 experiments, 16 KIF22-GFP R149L cells from 6 experiments, 17 KIF22-GFP R149Q cells from 4 experiments, and 21 KIF22-GFP V475G cells from 21 experiments. (C) Distance between separating chromosome masses 7 min after anaphase onset. Bars indicate medians. P values from Kruskal-Wallis test. P values are greater than 0.05 for comparisons without a marked p value. Data represent the same cell populations presented in (B). (D) Time-lapse images of dividing HeLa-Kyoto cells expressing mCherry (mCh)-CAAX to visualize cell boundaries. Times indicate minutes after anaphase onset. Arrowheads indicate cytokinesis failure. Imaged approximately 8 hr after treatment with doxycycline to induce expression and 24–32 hr after transfection with mCh-CAAX. Scale bars 20 μm. Images are representative of three or more experiments. (E) Distance between chromosome masses at the time of cleavage furrow ingression. P values from Kruskal-Wallis test. P values are greater than 0.05 for comparisons without a marked p value. Sixty-two KIF22-GFP cells from 10 experiments, 52 KIF22-GFP R149Q cells from 9 experiments, and 55 KIF22-GFP V475G cells from 9 experiments. See Figure 4—source data 1.

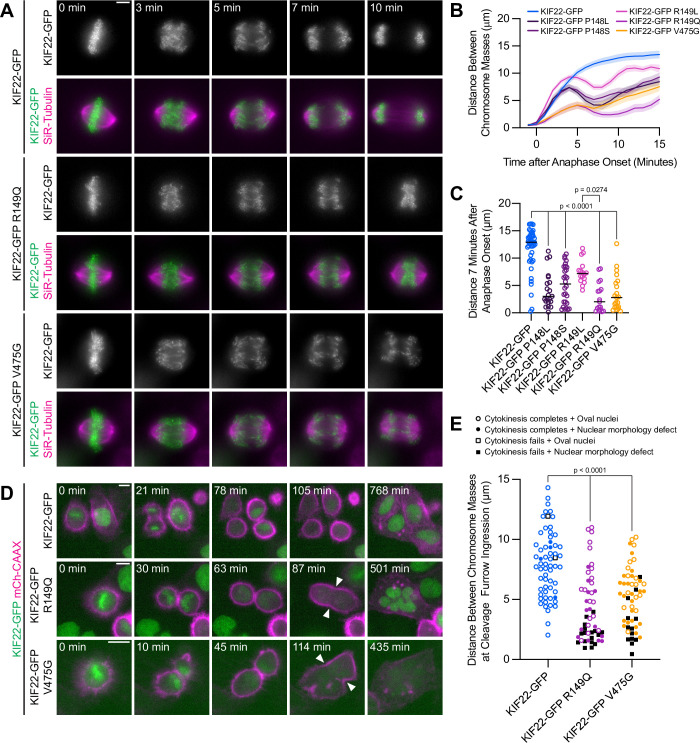
Figure 4—source data 1. Anaphase chromosome segregation and cytokinesis.
Distances between segregating chromosome masses during anaphase in HeLa-Kyoto cells expressing KIF22-GFP with pathogenic mutations. Rates of cytokinesis failure and distances between chromosomes masses at the time of furrow ingression.

Figure 4.

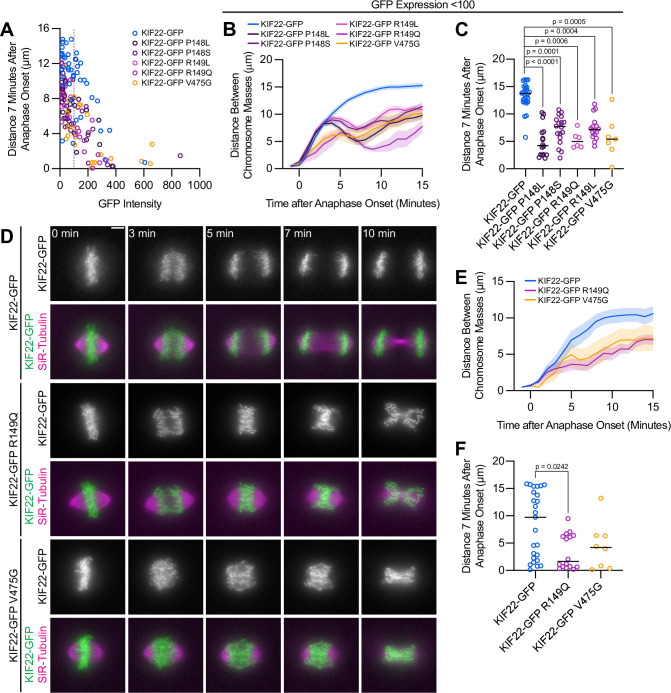
Figure 4—figure supplement 1. Anaphase recongression defects are KIF22-GFP expression level dependent and disrupt chromosome segregation in RPE1 cells.

Figure 4—figure supplement 1.

(A) Background-subtracted GFP intensity plotted against the distance between separating chromosome masses at 7 min to assess dependence of recongression on expression level (Spearman correlation coefficient –0.6246, one-tailed p-value<0.0001). Gray dashed line indicates mean background subtracted GFP intensity of 100. Forty-three KIF22-GFP cells from 10 experiments, 21 KIF22-GFP P148L cells from 6 experiments, 28 KIF22-GFP P148S cells from 7 experiments, 16 KIF22-GFP R149L cells from 6 experiments, 17 KIF22-GFP R149Q cells from 4 experiments, and 21 KIF22-GFP V475G cells from 21 experiments. (B) Distance between separating chromosome masses of cells expressing lower levels of KIF22-GFP (mean background subtracted GFP intensity less than 100). Lines represent the mean and the shaded area denotes SEM. Twenty-seven KIF22-GFP cells from nine experiments, 16 KIF22-GFP P148L cells from six experiments, 18 KIF22-GFP P148S cells from six experiments, 16 KIF22-GFP R149L cells from six experiments, 6 KIF22-GFP R149Q cells from three experiments, and 7 KIF22-GFP V475G cells from three experiments. (C) Distance between separating chromosome masses 7 min after anaphase onset of cells expressing lower levels of KIF22-GFP (mean background subtracted GFP intensity less than 100). Bars indicate medians. P values from Kruskal-Wallis test. P values are greater than 0.05 for comparisons without a marked p value. Data represent the same cell populations presented in (B). (D) Time-lapse images of dividing RPE-1 cells expressing KIF22-GFP R149Q or KIF22-GFP V475G. Imaged approximately 12–18 hr after treatment with doxycycline to induce expression. Times indicate minutes after anaphase onset. Images are maximum intensity projections in z through the entirety of the spindle. Scale bar 5 μm. Images are representative of three or more experiments. (E) Distance between separating chromosome masses throughout anaphase in RPE-1 cells. Lines represent the mean and the shaded area denotes SEM. Twenty-five KIF22-GFP cells from seven experiments, 16 KIF22-GFP R149Q cells from six experiments, and 8 KIF22-GFP V475G cells from six experiments. (F) Distance between separating chromosome masses 7 min after anaphase onset in RPE-1 cells. Bars indicate medians. P value from Kruskal-Wallis test. P values are greater than 0.05 for comparisons without a marked p value. Data represent the same cell populations presented in (E). See Figure 4—figure supplement 1—source data 1.
Figure 4—figure supplement 1—source data 1. RPE-1 anaphase chromosome segregation.
Distances between segregating chromosome masses during anaphase in RPE-1 cells expressing KIF22-GFP with pathogenic mutations.