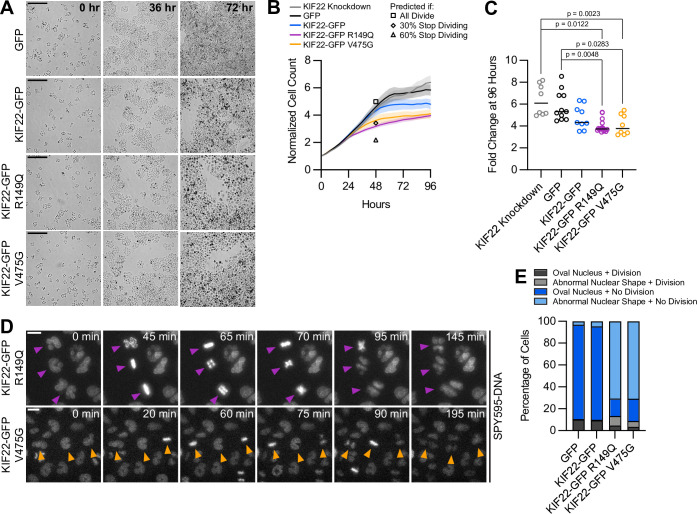
Figure 7. Proliferation is reduced in cells expressing KIF22 with pathogenic mutations.
(A) Time-lapse bright field images of HeLa-Kyoto cells to assess proliferation rate. Scale bar 500 μm. Images are representative of three or more experiments. (B) Proliferation rates measured using automated bright field imaging. Lines represent the mean cell count, normalized to the number of cells at 0 hr, and the shaded area denotes SEM. Black outlined shapes indicate the predicted cell count for cell lines expressing pathogenic mutations at 48 hr if every cell doubled every 20.72 hr (the doubling time measured from 48 hr of control cell proliferation) (square), if the rate of cytokinesis failure limited proliferation and 30% of cells did not divide (diamond), and if the rate of nuclear morphology defects limited proliferation and 60% of cells did not divide (triangle). (C) Fold change of normalized cell counts after 96 hr. Bars indicate medians. P values from Kruskal-Wallis test. P values are greater than 0.05 for comparisons without a marked p value. Data in (B) and (C) represent 8 KIF22 knockdown, 11 GFP, 9 KIF22-GFP, 16 KIF22-GFP R149Q, and 8 KIF22-GFP V475G technical replicates from four experiments. (D) Time-lapse imaging of HeLa-Kyoto cells treated with doxycycline for 24 hr to induce expression of KIF22-GFP with pathogenic mutations and stained with SPY595-DNA. Arrowheads indicate cells with abnormally shaped nuclei that divide. Images are maximum intensity projections in z of two focal planes, one at the level of interphase nuclei and one at the level of mitotic chromosomes. Scale bars 20 μm. Images are representative of three or more experiments. (E) Nuclear morphology at the start of imaging (dark gray or blue, oval; light gray or blue; abnormal morphology) and outcome (gray, cell divides during the experiment; blue, the cell does not divide). The total number of dividing cells was compared between cell lines using the chi-square test (p<0.0001 across all conditions). Post hoc chi-square tests comparing all conditions to one another indicated that the proliferation rate of cells expressing KIF22-GFP R149Q is statistically different than that of cells expressing GFP (p=0.0025), KIF22-GFP (p=0.0003), or KIF22-GFP V475G (p<0.0001). Applying the Bonferroni correction for multiple comparisons, a p value of less than 0.008 was considered significant. P values are greater than 0.008 for all other comparisons. 2461 GFP, 2611 KIF22-GFP, 1890 KIF22-GFP R149Q, and 2346 KIF22-GFP V465G cells. See Figure 7—source data 1.

