. 2022 Jun 22;11:e78653. doi: 10.7554/eLife.78653

Figure 8. Phosphomimetic mutation of T463 phenocopies pathogenic mutations in KIF22.

(A) Immunofluorescence images of monopolar HeLa-Kyoto cells. KIF22-GFP was visualized using an anti-GFP antibody. Fixed approximately 2–3 hr after treatment with monastrol and 24 hr after siRNA transfection and treatment with doxycycline to induce expression. Scale bar 5 μm. Images are representative of three or more experiments. (B) Distance from the spindle pole to the maximum DAPI signal, a measure of relative polar ejection force level, between HeLa-Kyoto cell lines expressing KIF22-GFP with phosphomimetic and phosphonull mutations at T463. Twenty-six GFP cells from three experiments, 26 KIF22-GFP cells from three experiments, 29 KIF22-GFP T463D cells from three experiments, and 29 KIF22-GFP T463A cells from three experiments. (C) Distance from the spindle pole to the maximum DAPI signal in cells depleted of endogenous KIF22 and expressing KIF22-GFP with phosphomimetic and phosphonull mutations at T463. Thirty-five GFP cells from four experiments, 36 KIF22-GFP cells from four experiments, 27 KIF22-GFP T463D cells from three experiments, and 47 KIF22-GFP T463A cells from four experiments. For (B, C), bars indicate means. P values from Brown-Forsythe and Welch ANOVA with Dunnett’s T3 multiple comparisons test. P values are greater than 0.05 for comparisons without a marked p value. (D) Time-lapse images of dividing HeLa-Kyoto cells. Cells expressing KIF22-GFP T463D exhibit recongression of the chromosomes during anaphase. Times indicate minutes after anaphase onset. Images are maximum intensity projections in z through the entirety of the spindle. Imaged approximately 18 hr after treatment with doxycycline to induce expression. Scale bar 5 μm. Images are representative of three or more experiments. (E) Distance between separating chromosome masses throughout anaphase in HeLa-Kyoto cells. Lines represent the mean and the shaded area denotes SEM. Thirteen KIF22-GFP, 32 KIF22-GFP T463D, and 24 KIF22-GFP T463A cells from five experiments. (F) Distance between separating chromosome masses 7 min after anaphase onset. Bars indicate medians. P values from Kruskal-Wallis test. P values are greater than 0.05 for comparisons without a marked p value. Thirteen KIF22-GFP, 32 KIF22-GFP T463D, and 24 KIF22-GFP T463A cells from five experiments per condition. (G) Measured solidity of nuclei in HeLa-Kyoto cell lines. Small circles represent the solidity of individual nuclei, and large circles with black outlines indicate the median of each experiment. A dashed line marks a solidity value of 0.950, the fifth percentile of solidity for control cells transfected with control siRNA and expressing GFP. (H) Percentage of nuclei with abnormal shape, indicated by a solidity value less than 0.950, the fifth percentile of control (control knockdown, GFP expression) cell solidity. A chi-square test of all data produced a p-value<0.0001. Plotted p values are from pairwise post hoc chi-square tests comparing control (control knockdown, GFP expression) cells to each other condition. Applying the Bonferroni correction for multiple comparisons, a p value of less than 0.00714 was considered significant. P values are greater than 0.00714 for comparisons without a marked p value. Data in (G) and (H) represent 312 GFP cells transfected with control siRNA, 362 GFP cells transfected with KIF22 siRNA, 314 KIF22-GFP cells transfected with control siRNA, 320 KIF22-GFP cells transfected with KIF22 siRNA, 361 KIF22-GFP T463D cells transfected with control siRNA, 376 KIF22-GFP T463D cells transfected with KIF22 siRNA, 312 KIF22-GFP T463A cells transfected with control siRNA, and 376 KIF22-GFP T463A cells transfected with KIF22 siRNA from three experiments. See Figure 8—source data 1.

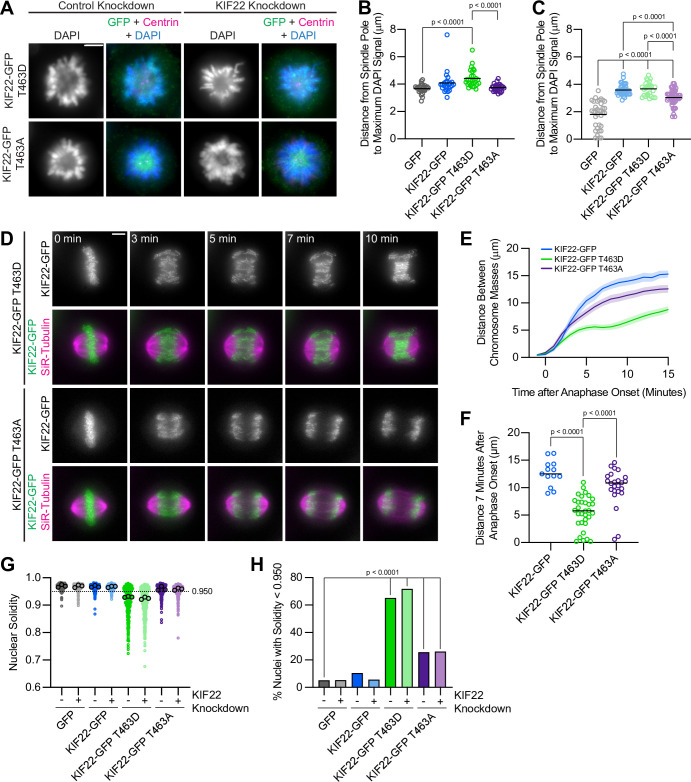
Figure 8—source data 1. T463 phosphomutants.
Measurements of relative polar ejection forces, distances between segregating chromosome masses, and nuclear solidity of HeLa-Kyoto cells expressing KIF22-GFP with mutations at T463.

Figure 8.

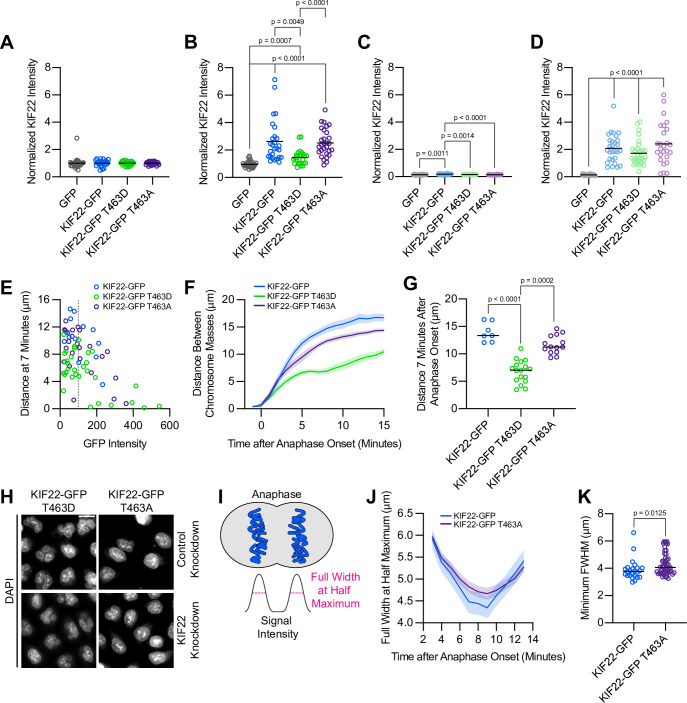
Figure 8—figure supplement 1. Cells expressing KIF22-GFP T463A have broader anaphase chromosome masses.

Figure 8—figure supplement 1.

(A–D) Quantification of KIF22 fluorescence intensity in untreated HeLa-Kyoto cells transfected with control siRNA (A), cells treated with doxycycline to induce expression and transfected with control siRNA (B), untreated cells transfected with KIF22 siRNA (C), and cells treated with doxycycline and transfected with KIF22 siRNA (D) normalized to the mean intensity of uninduced, control knockdown cells (endogenous KIF22 expression level) for each cell line (A). Thirty-two GFP, 25 KIF22-GFP,28 KIF22-GFP T463D, and 31 KIF22-GFP T463A untreated cells transfected with control siRNA (A), 29 GFP, 27 KIF22-GFP, 27 KIF22-GFP T463D, and 29 KIF22-GFP T463A doxycycline-treated cells transfected with control siRNA (B), 25 GFP, 26 KIF22-GFP, 23 KIF22-GFP T463D, and 26 KIF22-GFP T463A untreated cells transfected with KIF22 siRNA (C), 28 GFP, 28 KIF22-GFP, 31 KIF22-GFP T463D, and 26 KIF22-GFP T463A doxycycline-treated cells transfected with KIF22 siRNA (D), from three experiments. Bars represent means. P values from Brown-Forsythe and Welch ANOVA with Dunnett’s T3 multiple comparisons test. P values are greater than 0.05 for comparisons without a marked p value. (E) Plotting background-subtracted GFP intensity against the distance between separating chromosome masses at 7 min indicates that this distance is dependent on expression level (Spearman correlation coefficient –0.3964, one-tailed p-value=0.0004). Gray dashed line indicates mean background subtracted GFP intensity of 100. Thirteen KIF22-GFP, 32 KIF22-GFP T463D, and 24 KIF22-GFP T463A cells from five experiments. (F) Distance between separating chromosome masses of cells expressing lower levels of KIF22-GFP (mean background subtracted GFP intensity less than 100). Lines represent the mean and the shaded area denotes SEM. Seven KIF22-GFP cells from four experiments, 17 KIF22-GFP T463D cells from five experiments, and 14 KIF22-GFP T463A cells from four experiments. (G) Distance between separating chromosome masses 7 min after anaphase onset of cells expressing lower levels of KIF22-GFP (mean background subtracted GFP intensity less than 100). Bars indicate medians. P values from Kruskal-Wallis test. P values are greater than 0.05 for comparisons without a marked p value. Seven KIF22-GFP cells from four experiments, 17 KIF22-GFP T463D cells from five experiments, and 14 KIF22-GFP T463A cells from four experiments. (H) DAPI-stained nuclei of Hela-Kyoto cells. Fixed approximately 24 hr after treatment with doxycycline to induce expression. Scale bar 20 μm. Images are representative of three or more experiments. (I) Schematic depicting the measurement of chromosome signal intensity in anaphase and the use of the full width at half maximum (FWHM) as a measure of anaphase chromosome mass broadness. (J) FWHM of the plotted intensities of separating chromosome masses of HeLa-Kyoto cells expressing KIF22-GFP or KIF22-GFP T463A. Lines represent the mean and the shaded area denotes SEM. (K) Minimum FWHM value, representing maximal anaphase chromosome compaction, between cells expressing KIF22-GFP and KIF22-GFP T463A. P value from Mann-Whitney test. Bars represent medians. Data in (J) and (K) represent 12 KIF22-GFP and 24 KIF22-GFP T463A cells (24 KIF22-GFP and 48 KIF22-GFP T463A chromosome masses) from five experiments. See Figure 8—figure supplement 1—source data 1.
Figure 8—figure supplement 1—source data 1. T463 KIF22 expression level.
KIF22 expression levels in HeLa-Kyoto cells expressing KIF22-GFP with mutations at T463. Broadness of segregating anaphase chromosome masses in cells expressing KIF22-GFP T463A.