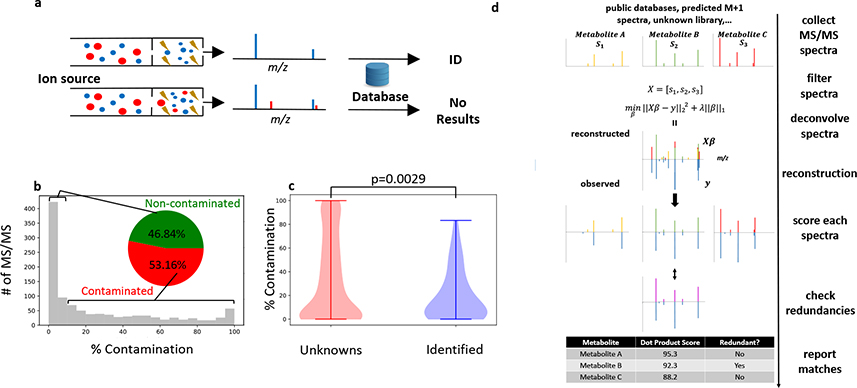
Figure 1. Deconvolution with DecoID to identify metabolites with chimeric MS/MS spectra.
(a) Schematic of a chimeric (bottom) and non-chimeric (top) MS/MS spectrum. Each color represents a unique precursor ion. Smaller circles indicate fragments. When searched in MS/MS databases, chimeric spectra do not lead to identifications (or, even worse, they lead to incorrect identifications). (b) Histogram showing the percentage contamination of MS/MS spectra from the analysis of NIST SRM 1950 human plasma with DDA and a 1 m/z isolation window. Despite using a narrow isolation window, greater than 50% of the acquired spectra have more than 10% contamination. (c) MS/MS spectra that were not able to be identified with spectral matching to mzCloud had significantly higher levels of MS/MS contamination (two-sided two-sample Kolmogorov–Smirnov test) than those spectra that were able to be identified. Horizontal lines on top and bottom of violin plot represent the maximum and minimum values. (d) Diagram of the DecoID search algorithm. A library of reference MS/MS spectra is assembled from metabolomic databases, predicted isotopologue spectra, and pure unknowns. This library of reference MS/MS spectra is filtered on the basis of MS1 information, the size of the MS/MS isolation window, and retention time (if available) for each experimentally observed MS/MS pattern in the user’s data. The experimentally observed MS/MS spectrum is then reconstructed by using the filtered library spectra and non-negative LASSO regression. All components used in the deconvolution are scored against the library spectra on the basis of accurate mass and spectral similarity. Lastly, all reference library spectra used for the deconvolution undergo a redundancy check to determine whether an equally good deconvolution could have been achieved by using a different set of library spectra. Potentially redundant components are flagged in the report provided to the user.

