
Figure 3. DecoID improves metabolite identification in the DDA and DIA IROA datasets.
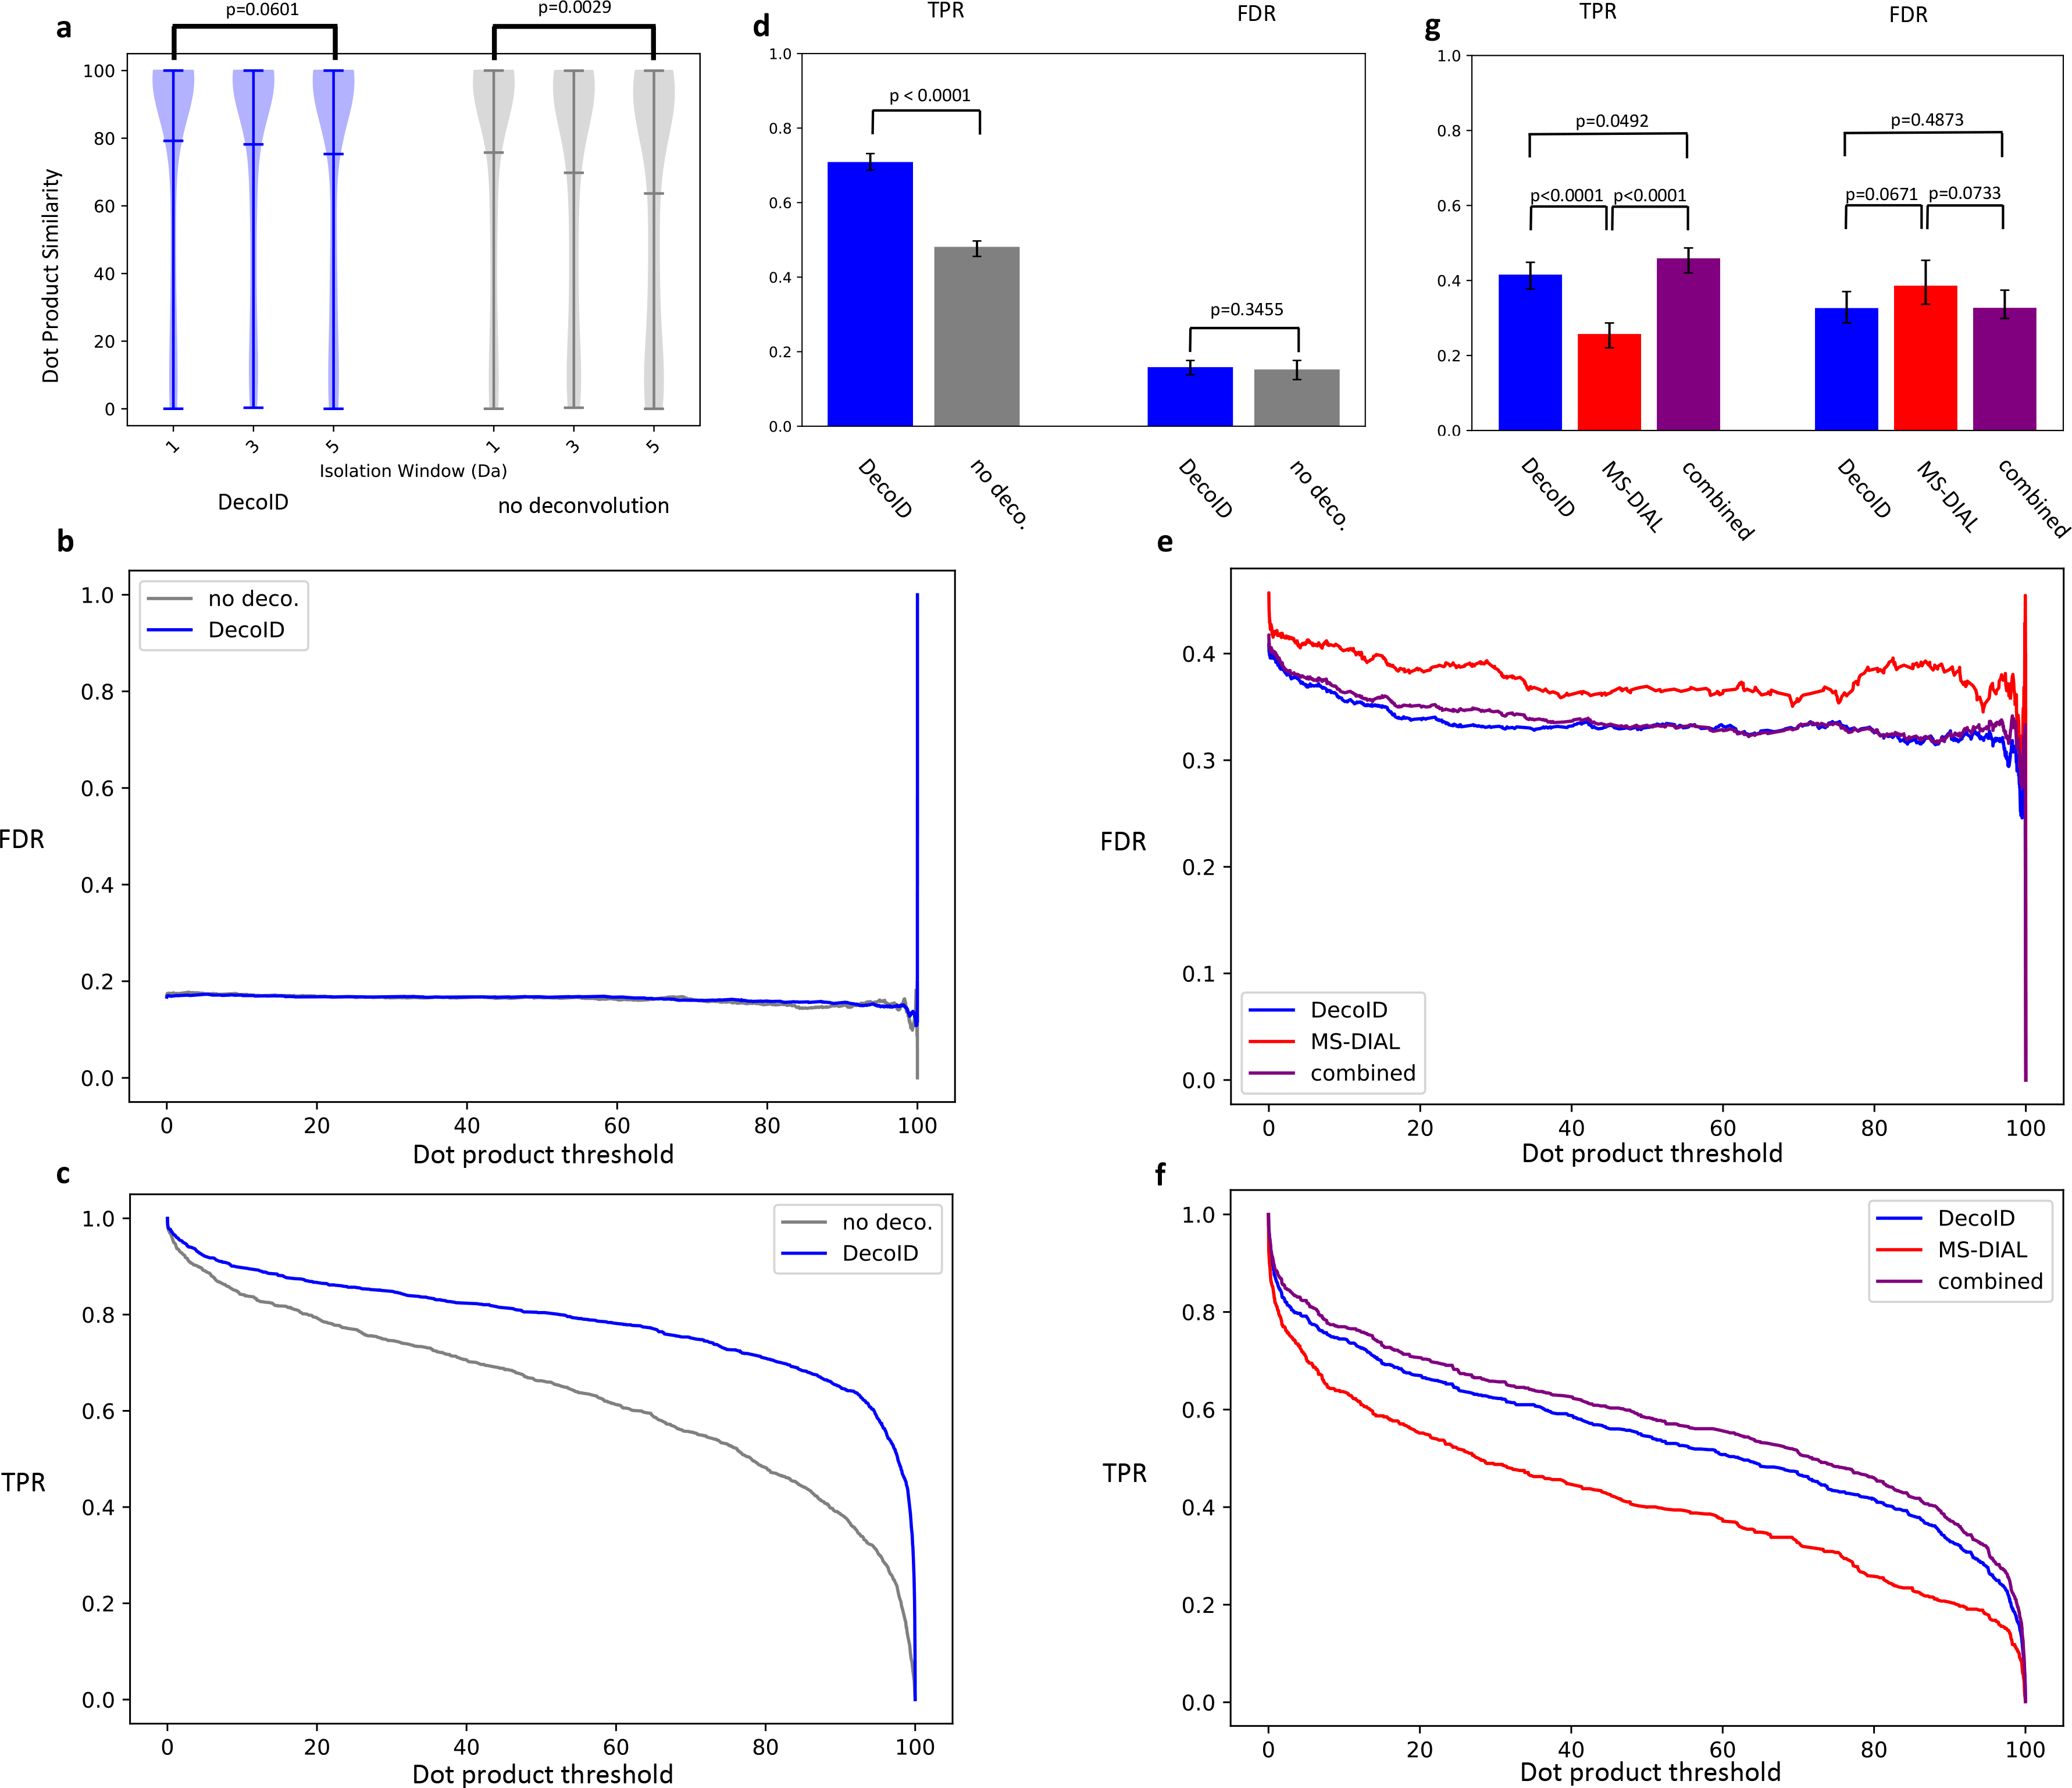
(a) Without deconvolution, dot product similarity to a database spectrum decreased as the MS/MS isolation window increased (producing more contaminated spectra) in the negative mode IROA DDA dataset. After deconvolving with DecoID, no decrease in similarity occurred. The horizontal lines on the violin plots represent the mean, maximum, and minimum similarity values. (b-c) The FDR (b) and TPR (C) are plotted as a function of dot product threshold for DecoID and directly searching the acquired spectra (no deconvolution) from the IROA DDA dataset. At all thresholds, DecoID had nearly the same FDR as when no deconvolution was performed and a higher TPR. (d) Using DecoID and a dot product threshold of 80, there was no significant increase in FDR, but there was a significant increase in TPR. (e-f) When DecoID was used alone or when the combined approach was used, the FDR (e) was intrinsically lower and the TPR (f) was higher than when MS-DIAL was used alone on the IROA DIA dataset. (g) DecoID and the combined approach significantly increased the TPR relative to MS-DIAL when using a dot product threshold of 80. Results shown in b-g are from the top MS/MS match for each metabolite in the positive-mode and negative-mode data. Results are aggregated from the in-house database, mzCloud, HMDB, and MoNA. Data shown in (d) and (g) represent mean FDR/TPR +/− 95% empirical confidence interval derived from bootstrap resampling (n=10,000) the IROA DDA and DIA dataset and calculating the FDR and TPR on each independently resampled dataset (see Methods). Statistical significance in (a) was assessed using the two-sided two-sample Kolmogorov–Smirnov test. Statistical significance in (d) and (g) was assessed through 2-sided comparison of the bootstrapped FDR and TPR distributions (Methods).