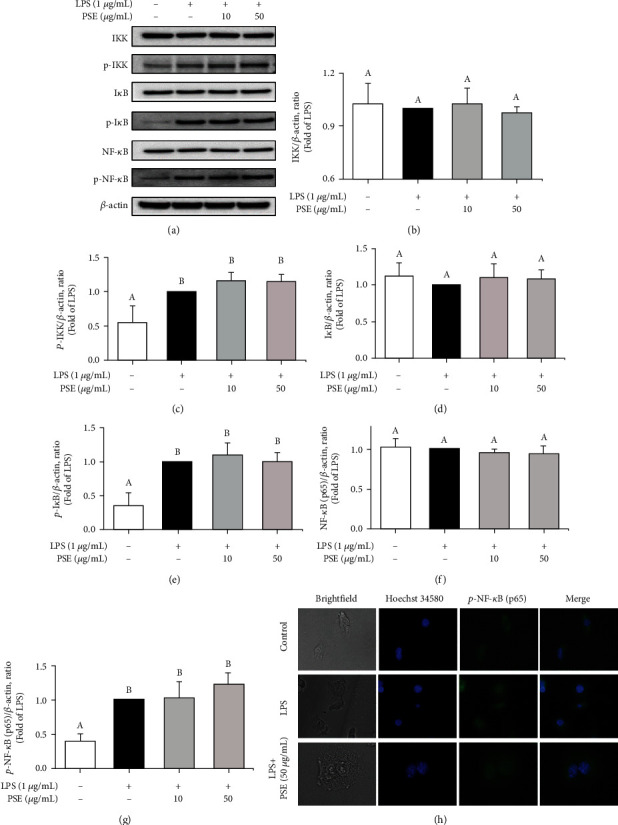
Figure 4.

Effect of PSE on the activation of NF-κB signaling. The cells were pretreated 1 μg/mL LPS for 1 h and treated with 10 and 50 μg/mL PSE for 3 h. Expression of IKK, p-IKK, IκB, p-IκB, NF-κB, and p-NF-κB were determined by Western blot analysis (a). The ratios of IKK (b), p-IKK (c), IκB (d), p-IκB (e), NF-κB (f), and p-NF-κB (g) are shown. The cells were pretreated 1 μg/mL LPS for 1 h and treated with 50 μg/mL PSE for 24 h. The localization of phosphor-NF-κB (p-p65) and nuclei were determined by staining with anti-phospho-p65 (green) and Hoechst 34580 (blue) (h). Images were obtained by microscopy at 40x magnification. Data are presented as mean ± SD from three independent experiments. p value < 0.05 was considered statistically significant by Duncan's test.
