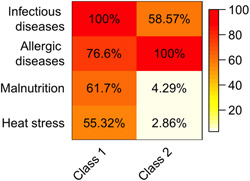
Figure 1.

Response probabilities among the two latent classes. The figure illustrates the two classes identified by means of LCA. The proportion of each variable in each class is represented with a color scale spanning from white (0%) to red (100%). LCA, latent class analysis [Color figure can be viewed at wileyonlinelibrary.com]
