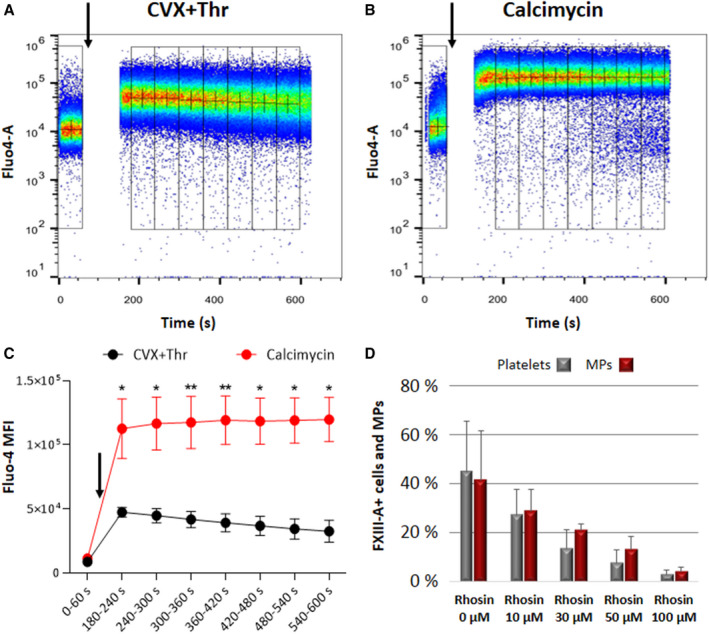
FIGURE 8.

Agonists induced intracellular Ca2+ signal and the effect RhoA inhibitor on cFXIII transposition. Intracellular Ca2+ signal was measured by Fluo‐4 fluorescence in a flow cytometer. Representative pseudocolor plots of platelets treated either with (A) 125 ng/ml convulxin (CVX) plus 0.5 U/ml thrombin (Thr) or (B) 0.7 µM calcimycin. Administration of the agonists is indicated by arrows following a 60 s baseline acquisition. Fluorescence data were binned every 60 s (indicated by adjacent boxes), + signs represent the median of each bin. The time‐gap in the record corresponds to the addition of the agonists and the instrumental lag in data acquisition. C, Plots of median fluorescence intensity (MFI) for eight adjacent 60‐s‐long bins for platelets treated with CVX+Thr (in black), and the same dataset for calcimycin treatment (in red). Asterisks indicate significant change in the fractional fluorescence increase upon calcimycin versus CVX+Thr treatment (*P < .05, **P < .01). D, The effect of Rhosin (RhoA inhibitor) on the CVX+Thr induced surface translocation of cFXIII. Data shown in (C,D) represent the means of three individual measurements ± standard deviation
