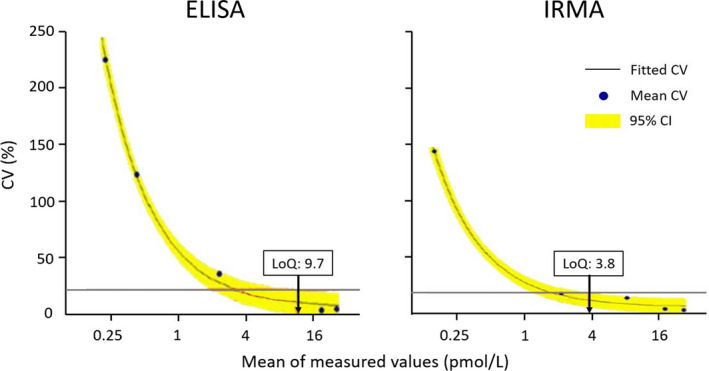
FIGURE 1.

Curve fits by EPE‐12 module, providing LoQ values of 9.7 pmol/L for the ELISA C‐peptide assay with a predefined target‐CV of 23% (red line ELISA) and 3.8 pmol/L for the IRMA C‐peptide assay with a predefined target‐CV of 20% (red line IRMA). CI, confidence interval; CV, coefficient of variation; ELISA, enzyme‐linked immunosorbent assay; IRMA, immunoradiometric assay. Graphs were generated by EP Evaluator 12 (Data Innovations LLC)
