
FIGURE 3.
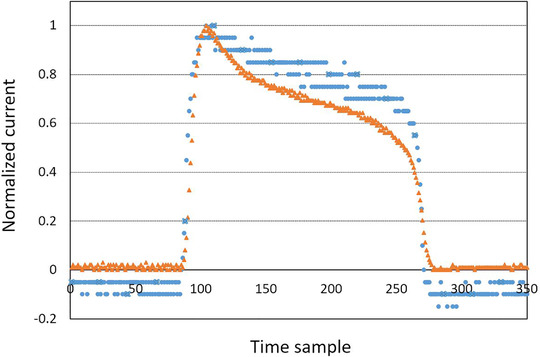
Comparison of the normalized raw signal from the initial monitor system (blue circles) and the newly mounted beam current transformer (BCT) (orange triangles) for same ultrahigh dose rate (UHDR) pulse
Official websites use .gov
A
.gov website belongs to an official
government organization in the United States.
Secure .gov websites use HTTPS
A lock (
) or https:// means you've safely
connected to the .gov website. Share sensitive
information only on official, secure websites.
Comparison of the normalized raw signal from the initial monitor system (blue circles) and the newly mounted beam current transformer (BCT) (orange triangles) for same ultrahigh dose rate (UHDR) pulse