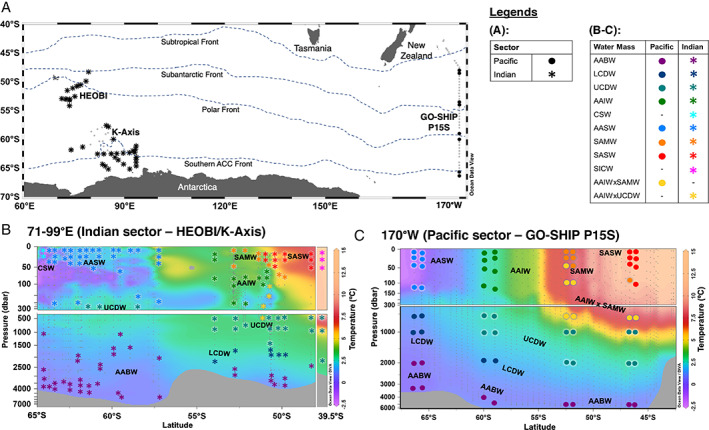
Fig. 1.

A. Map of microbial sampling stations within the HEOBI, K‐Axis and GO‐SHIP P15S transects. Stations where full‐depth microbial profile analysis were conducted are indicated based on the longitudinal sector they belong to by a closed circle (Pacific sector samples) or bold star (Indian sector samples). Frontal locations indicated are approximate latitudes only. Cross‐section showing vertical distribution of temperature at B. 71–99°E (HEOBI and K‐Axis transects) and C. 170°W (P15S transect), as well as microbial sampling locations and their distribution (indicated by coloured symbols based on the water mass they are categorized to) across the major water masses. Smaller grey dots indicate sampling points for the temperature profile. AABW – Antarctic Bottom Water; LCDW – Lower Circumpolar Deep Water; UCDW – Upper Circumpolar Deep Water; AAIW – Antarctic Intermediate Water; CSW – Continental Shelf Water; AASW – Antarctic Surface Water; SAMW – Subantarctic Mode Water; Subantarctic Surface Water; SICW – South Indian Central Water. Several samples were identified to harbour temperature‐salinity characteristics of two different water masses (regions where water mass mixing occurred): AAIWxSAWM – water with mixed characteristics of AAIW and SAMW; AAIWxUCDW – water with mixed characteristics of AAIW and UCDW.
