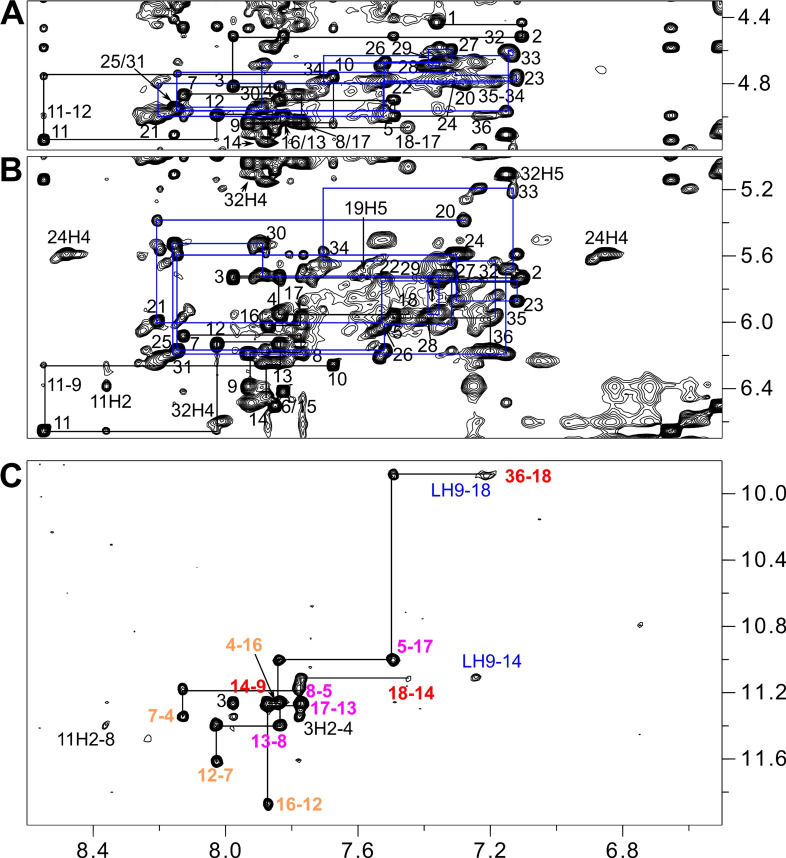
Figure 4.
Regions of a 2D NOESY spectrum (300 ms mixing time, 30 °C) of QD3‐sbl (1 mM) in the presence of 1 equiv. SYUIQ‐5. (A) H6/8(ω2)−H3’(ω1) and (B) H6/8(ω2)−H1’(ω1) spectral region; continuous networks of base‐sugar resonances are followed by vertical and horizontal lines with NOE connectivities in the duplex domain traced by blue lines; intra‐nucleotide cross‐peaks are labeled by residue number. (C) H8/6/2(ω2)−H1(ω1) spectral region; intra‐tetrad H8(ω2)−H1(ω1) cross‐peaks are labeled with colors depending on G‐tetrad layer; inter‐tetrad connectivities along the G‐columns are traced by horizontal and vertical lines and intermolecular contacts between quadruplex imino and ligand protons are labeled in blue.

