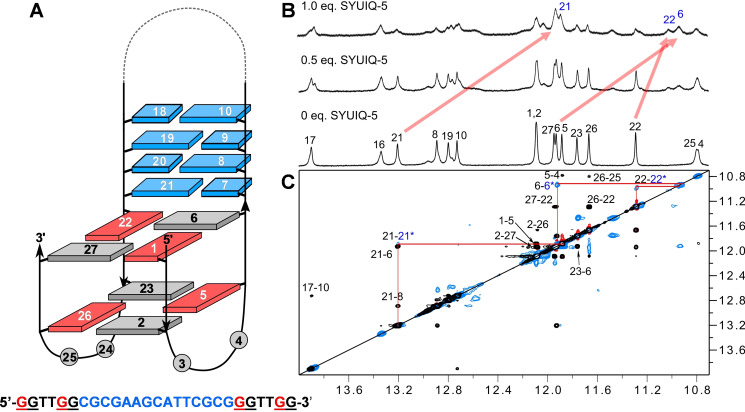
Figure 7.
(A) Topology of QD2‐l with sequence. (B) Imino proton spectral region upon titrating SYUIQ‐5 to QD2‐l (0.5 mM) at 20 °C; most pronounced shifts are indicated by red arrows. (C) Superposition of NOESY spectrum for the free hybrid (black) and ROESY spectrum after the addition of 0.5 equiv. of ligand (blue: positive intensity; red: negative intensity) showing imino(ω2)‐imino(ω1) correlations; red lines connect most shifted proton resonances at the Q‐D junction as verified through exchange cross‐peaks between the free and complexed QD2‐l hybrid. Residue numbers of the free and ligand‐bound hybrid are marked in black and blue, respectively.

