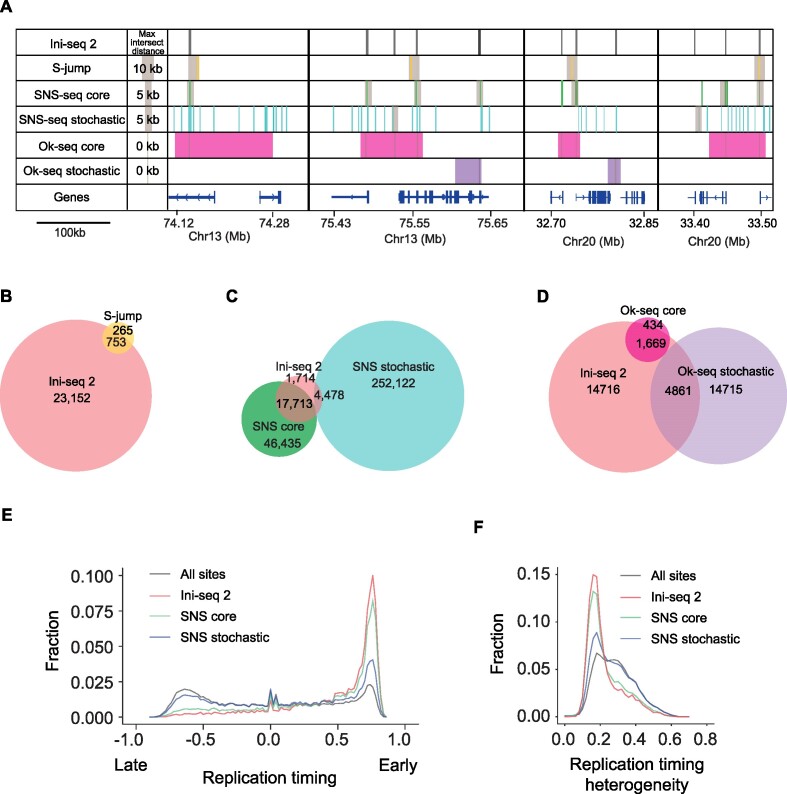
Figure 4.
Comparison of ini-seq 2 origins mapped in other cell lines. (A) Four representative genomic regions illustrating the position of origins identified by ini-seq 2 (black bars), S-jumps (yellow bars), SNS-seq core (green bars), SNS-seq stochastic (turquoise bars), Ok-seq core (magenta bars) and Ok-seq stochastic (purple bars). Gray boxes indicate the maximum distance that has been allowed to accept an intersect, computed based on the average size of the origins called by each method (see Materials and Methods). (B–D) Venn diagrams showing the overlap between (B) ini-seq 2 origins and S-jumps, permutation test P = 0.0001, Z-score 58; (C) ini-seq 2 origins and SNS-seq, permutation test for core and stochastic, respectively, P = 0.0001, Z-score 379 and P = 0.0001, Z-score 217; (D) ini-seq 2 origins and Ok-seq, permutation test for core and stochastic, respectively, P = 0.0001, Z-score 89 and P = 0.0001, Z-score 61. (E) Distribution of origins determined by ini-seq 2 and SNS-seq as a function of replication timing. (F) Distribution of origins determined by ini-seq 2 and SNS-seq as a function of replication timing heterogeneity observed across nine cell lines (see Materials and Methods).

