Figure 5.
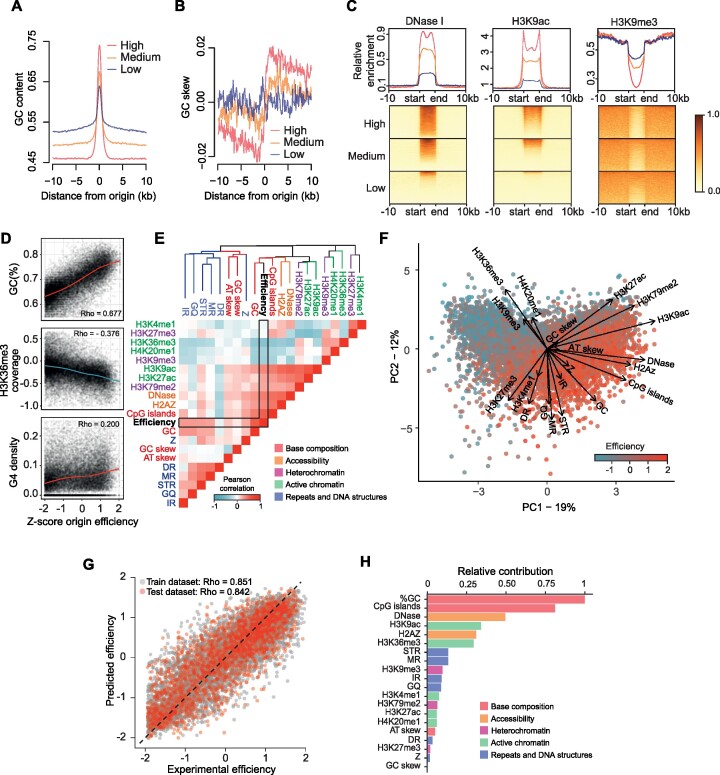
Determinants of origin efficiency. (A) GC content in a 20 kb window around origin centres for the three efficiency classes of ini-seq 2 origins. (B) GC skew (G – C / G + C) computed in 100 bp bins in a 20 kb window around the origin center for the three efficiency classes of ini-seq 2 origins. (C) Coverage plots for DNase I hypersensitivity, H3K9 acetylation and H3K9 trimethylation within and 10 kb around the three efficiency classes of ini-seq 2 origins. Origin lengths were scaled and are defined by ‘start’ and ‘end’ labels. (D) GC content, H3K36 trimethylation and G4 density as a function of origin efficiency. Correlation: Pearson. (E) Heatmap reporting the correlation between pairwise combinations of origin features. Blue = negative Pearson correlations; Red = positive Pearson correlations. The dendrogram is generated using an unsupervised clustering algorithm based on distances computed from Pearson correlations (see Materials and Methods). The colors of the branches denote the five types of origin features. Abbreviations: IR, inverted repeat; GQ, G quadruplex; STR, short tandem repeat; MR, mirror repeat; DR, direct repeat; Z, Z-DNA. (F) Principal component analysis of origin efficiency using features described in panel (E), highlighting the strength and direction, i.e. eigenvectors, for the contribution of each feature to origin efficiency. (G) A statistical model allows prediction of origin efficiency using these features as predictors. Origins used to train and test the model are depicted in gray and red, respectively. (H) Quantitative estimate of predictor contribution to the statistical model. The colors of the bars denote the five types of origin features.

