Figure 6.
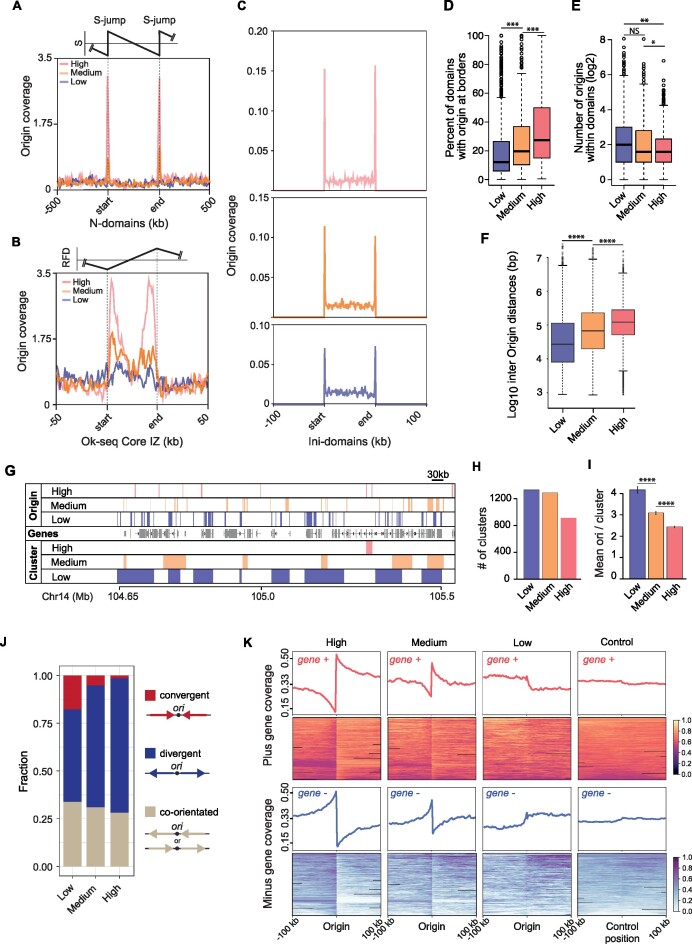
The higher-order organisation of replication origins by efficiency. (A) Origin coverage grouped by efficiency in normalised N-domains ± 500 kb. (B) Origin coverage grouped by efficiency in Ok-seq core initiation zones ± 50 kb. (C) Origin coverage grouped by efficiency in ini-domains ± 100 kb. (D) Percentage of ini-domains with origins of each efficiency class at their boundaries. ***P < 1 × 10⁻⁷; K-S test. (E) Number of origins of each efficiency class within the ini-domains (borders analysed in D were excluded). **P < 1 × 10⁻⁵; *P < 1 × 10⁻³; K-S test. (F) Inter-origin distances grouped by origin efficiency class. Central bar = median; whiskers = interquartile range. ****P < 2.2 × 10⁻¹⁶; K-S test. (G) Origin clustering. Example IGV screenshot showing the clustering of ini-seq 2 origins by efficiency in a ∼ 1 Mb region of chromosome 14. Top three lanes: mapping of the three efficiency classes of ini-seq 2 origins. Middle lane: genes. Lower three lanes: Origin clusters determined using the clusterdist function of clusterscan (33), set at 30 kb (see Materials and Methods). (H) Number of clusters found in each ini-seq 2 origin efficiency class. (I) Mean number of origins per cluster for each efficiency class (****P < 5 × 10–12 for low versus medium; P < 7 × 10–15 for medium versus high. (J) Quantification of the orientation of the first gene either side of an origin, grouped by origin efficiency class. Gene orientation of the two adjacent genes is classed by the direction of transcription as convergent, divergent or co-orientated. (K) Gene orientation coverage around the three classes of ini-seq 2 origins and a randomised control compared with 8,000 randomly picked positions from a pool of genomic locations that are equidistant from two origins.

