FIGURE 2.

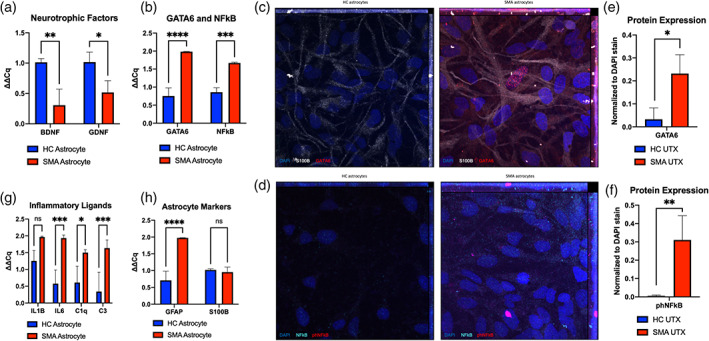
GATA6 and nuclear NFĸB upregulation in SMA astrocytes. (a) Decreased neurotrophic support through BDNF, GDNF and (b) increased GATA6, NFĸB transcript production confirmed in SMA astrocytes compared to healthy controls. (c) Representative images of GATA6 and (d) phNFĸB protein expression in SMA and HC astrocytes by immunocytochemistry ([c] GATA6 = red, S100β = white, DAPI = blue; [d] phNFĸB = pink, NFĸB = teal, DAPI = blue) ([e, f] quantification). (g) Upregulation of transcripts for pro‐inflammatory cytokines and complement factors (IL1β, IL6, C1q, C3) and (h) activation marker GFAP in SMA astrocytes compared to HC, with no changes in general astrocyte marker S100β expression. ICC quantification displays relative fluorescence (total fluorescence for each channel normalized to DAPI) for each image to account for differences in cell density between ROIs. (1‐way ANOVA, Tukey's multiple comparisons test. *p value<0.05, ** < 0.005, *** < 0.0005, **** < 0.0001)
