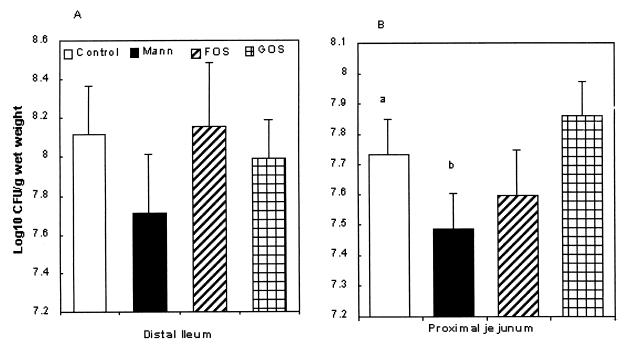
FIG. 2.
(A) Number of salmonellae (log10 CFU/g/[wet weight]) associated with ileal tissue (STM S986) after 1 h of incubation in the presence of carbohydrates (2.5%) (n = 10, where n denotes the number of organ cultures). (B) Number of E. coli (log10CFU/g [wet weight]) associated with jejunal tissue after 1 h in the presence or absence (control) of mannose or NDO's at 2.5% (n = 10).The letters “a” and “b” denote a significant difference (P < 0.05).

