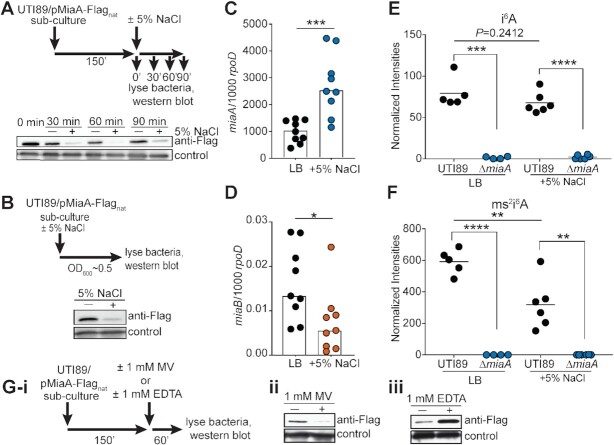
Figure 4.
High salt stress downregulates MiaA translation and reduces ms2i6A levels. (A) Top panel shows schematic of the experimental setup. UTI89/pMiaA-Flagnat was diluted from overnight cultures into fresh LB and grown shaking for 2.5 h at 37°C prior to resuspension in LB or LB + 5% NaCl. Incubations were continued for the indicated times before samples were collected and analyzed by western blots using anti-Flag and anti-E. coli (loading control) antibodies (bottom panel). (B) Top panel summarizes the experimental setup in which overnight cultures of UTI89/pMiaA-Flagnat were diluted directly into fresh LB or LB + 5% NaCl and grown shaking to OD600 of 0.5 prior to processing for western blot analysis (bottom panel). (C and D) UTI89 from mid-logarithmic cultures in LB was resuspended in LB or LB + 5% NaCl and 1 h later the levels of miaA and miaB transcripts were determined by RT-qPCR. Bars indicate mean values from 9 independent replicates, each with two technical replicates. *P< 0.05; ***P< 0.001 by Mann–Whitney U tests. (E and F) Graphs show normalized levels of i6A and ms2i6A recovered from UTI89 and UTI89ΔmiaA following growth to OD600 of 0.5 in LB or LB + 5% NaCl, as determined by LC–MS. **P< 0.01; ***P< 0.001; ****P < 0.0001 by unpaired t tests. Bars indicate median values from four to six independent replicates. (G(i)) Schematic of the experimental setup in which 1 mM (ii) MV or (iii) EDTA were added to UTI89/pMiaA-Flagnat cultures for 1 h prior to processing for western blot analyses.

