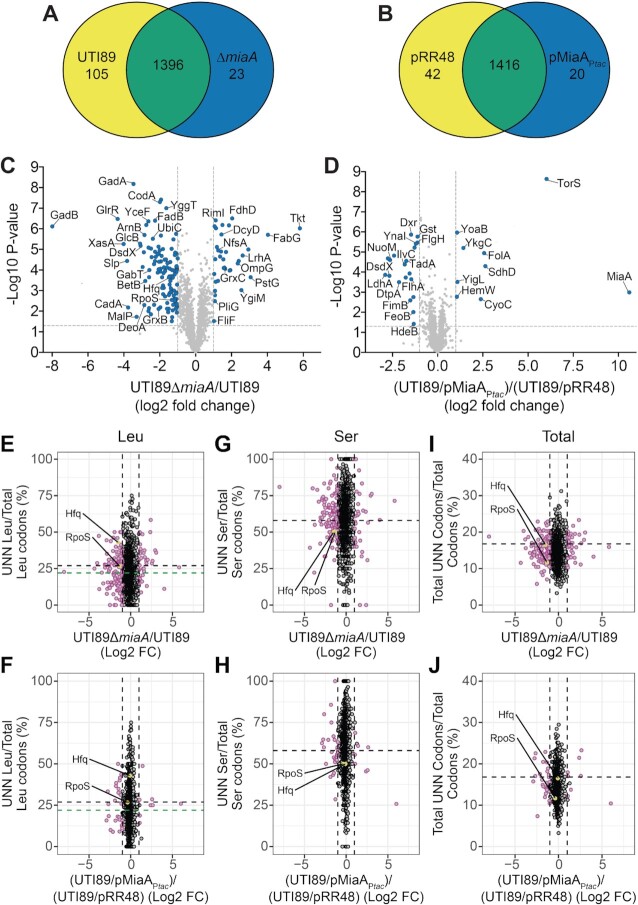
Figure 7.
Altering MiaA levels changes the spectrum of expressed proteins. (A and B) Venn diagrams indicate numbers of unique and shared proteins detected in wild-type UTI89 versus UTI89ΔmiaA, or in UTI89/pRR48 versus UTI89/pMiaAPtac, following growth to OD600 of 0.5 in LB. IPTG (1 mM) was included in the UTI89/pRR48 and UTI89/pMiaAPtac cultures. Relative protein levels were determined by MudPIT. (C and D) Volcano plots show relative protein levels (Log2-fold change) versus P values (–Log10). Vertical dashed lines denote 2-fold change cutoffs, while the horizontal dashed lines indicate a P value of 0.05. Blue dots, proteins that were significantly changed (P< 0.05) by at least 2-fold. P values were determined by Student's t tests; n = 4 independent replicates for each group. (E–J) Plots show relative protein levels (Log2-fold change as noted in C and D) versus UNN codon usage ratios for Leu, Ser, or total UNN codons per open reading frame. For I and J, total codons refer specifically to those for Leu, Ser, Cys, Phe, Trp and Tyr. Purple circles, proteins that were significantly changed (P< 0.05, by Student's t tests) by at least 2-fold in UTI89ΔmiaA or UTI89/pMiaAPtac relative to their controls. Positions for Hfq and RpoS are highlighted (yellow). The vertical dotted lines are placed at the 2-fold change cutoffs. Black and green horizontal dashed lines specify the mean UNN codon usage ratios for all open reading frames encoded by UTI89 and the K-12 strain MG1655, respectively.

