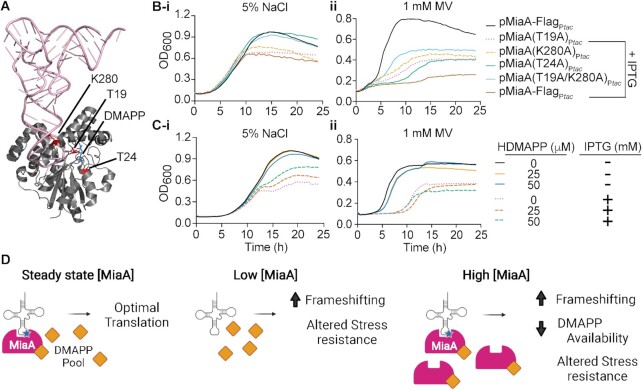
Figure 8.
Conditional adverse effects of increased DMAPP binding by MiaA. (A) Crystal structure-based model of MiaA (grey) complexed with tRNA (pink) and DMAPP (blue). The three residues that were mutated to alanines are indicated. Image created using PyMOL with structural information (2ZXU) downloaded from the RCSB Protein Data Bank (125). (B) Graphs show growth curves for recombinant UTI89 strains with the specified plasmids in (i) LB with 5% NaCl (left) or (ii) 1 mM MV (right) ±1 mM IPTG, as indicated. (C) Growth curves for UTI89/pMiaAPtac in (i) LB with 5% NaCl (left) or (ii) 1 mM MV (right) ± HDMAPP and IPTG, as noted. Each curve shows average values from four replicates and are representative of three independent experiments. (D) A working model of how changing levels of MiaA can impact translational fidelity and stress resistance. Created with Biorender.com.

