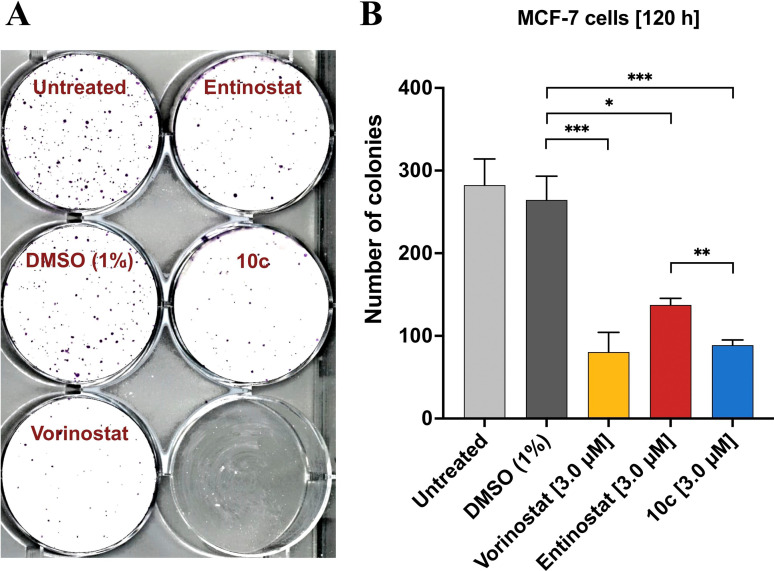
Figure 11.
Effect of HDAC inhibition on colony formation (clonogenic assay) in MCF‐7 cells. A) Representative image of clonal proliferation after seeding 750 single cells per well. Prior to plating, cells were treated for 48 h with the respective agent (3.0 μM; as indicated) or left untreated. B) Quantitation of colony formation. Mean values ±SD (three independent experiments) of the absolute number of colonies is given. Significances were determined using the t‐test (n=3) and are indicated by asterisks (*p<0.05; **p<0.02; ***p<0.01).

