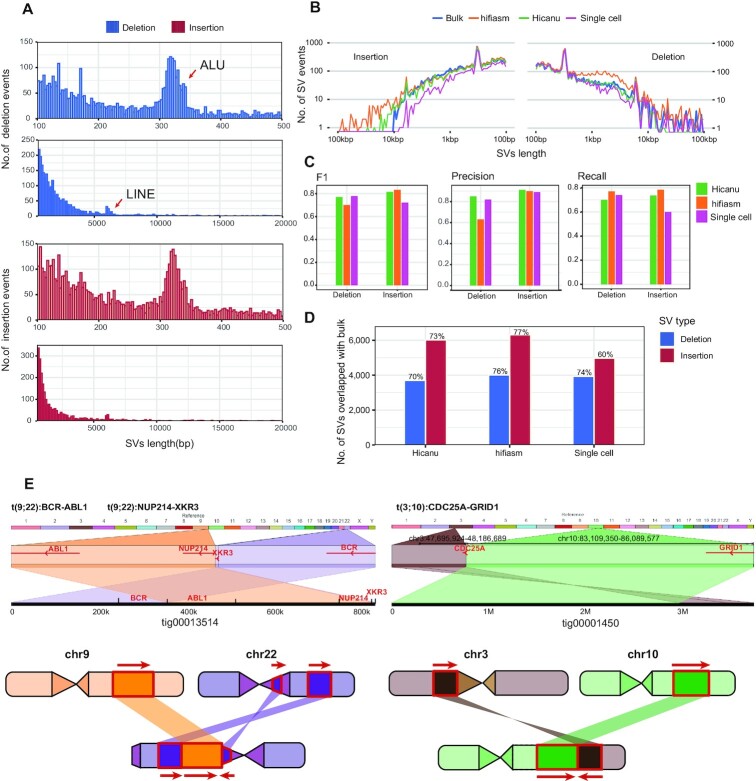
Figure 4.
SVs discovery and distribution from K562 cells assembly. (A) Size distribution of SVs identified from K562 cells with hifiasm assembly, 300 bp peak for ALU and 6kb peak for LINE. (B) Length distribution of SVs identified from Hicanu assembly, hifiasm assembly, raw single cell HiFi reads and bulk CLR reads. (C) The precision, recall and F1-score of SVs identified from Hicanu assembly, hifiasm assembly, raw single cell HiFi reads, where bulk CLR SVs were treated as ground truth. (D) The percentage of true positive SVs identified from Hicanu assembly, hifiasm assembly, raw single cell HiFi reads, where bulk CLR SVs were treated as ground truth. (E) Ribbon (56) visualization the translocations in K562 cells. The diagram on the left indicates the detailed positions and directions of the translocation of BCR-ABL1 locus and NUP214-XKR3 locus. The right diagram indicates the translocation of chr3 with chr10 generates CDC25A-GRID1 fusion gene, which is not detected in single cell direct mapping result.

