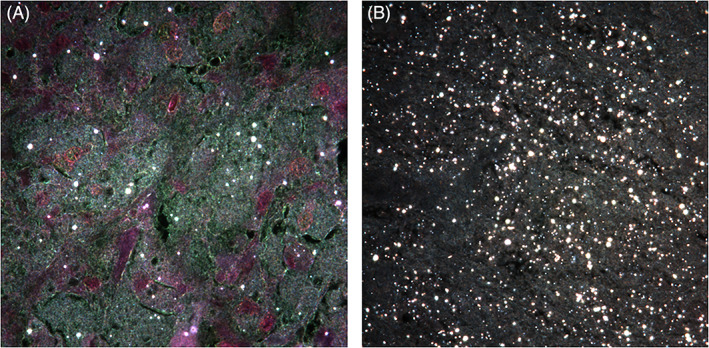
FIGURE 4.

High resolution darkfield microscopy images (H&E, 100×) showing tissue samples from the cup group (A) and stem group (B) containing wear particles (including CoCrMo, ZrO2, and PE) which appear white. Representative image from each study group
